Venn Diagrams Questions and Answers

Questions on Venn Diagrams

A diagram demonstrating the mathematical or logical arrangements visually in the form of circles or closed curves inside an enfolding rectangle and the common essentials of the groups being signified by intersections of the circles is known as the Venn diagram. On this page we will discuss questions related to Venn Diagrams

formulas for Venn Diagrams Questions

Formula or Rule for finding the HCF of given numbers:

  • n(X ∪ Y) = n(X ) + n ( Y ) – n ( X∩ Y)
  • n(X ∪ Y ∪ C) = n(X ) + n ( Y ) + n (C) – n ( X ∩ Y) – n ( Y ∩ C) – n ( C ∩ X) + n (X ∩ Y ∩ C )
  • In case of two elements: Where;
    A = elements belong to set X only
    B = elements belong to set Y only
    C = elements belong to bot set X and Y (XY)
    F = elements belong to none of the sets X or YB
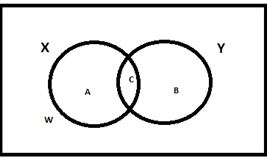
  • From the above figure, it is clear that
    n(X) = a + c ;
    n (Y) = b + c ;
    n(X ∩ Y) = c;
    n ( X ∪ Y) = a +b+ c.
    Total number of elements = a + b + c + f

In the case of three elements
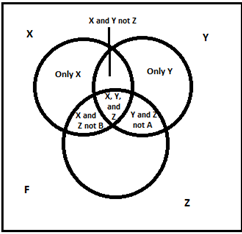
  • F = elements belong to none of the sets X, Y or Z
     

Prime Course Trailer

Related Banners

Get PrepInsta Prime & get Access to all 200+ courses offered by PrepInsta in One Subscription

Also Check Out

Venn Diagram Questions and Answers 

1. There are 100 people in the office, 70 employees like Pizza and 60 employees like Pasta, and 40 Employees like both Pizza and pasta.
i.) How many employees like only Pizza?
ii.) How many employees like only Pasta?
iii.) How many employees like neither Pizza nor Pasta?

10,20,30

10,20,30

12.72%

30,20,10

30,20,10

77.89%

40,10,20

40,10,20

6.94%

10,15,30

10,15,30

2.46%

1.) Number of employees who like only Pizza= 70-40= 30
2.) Number of employees who like only Pasta= 60-40= 20
3.) Number of employees who like neither Pizza nor Pasta= 100- 30- 20 -40= 10

2. The below mentioned questions contains three elements which may or may not be interlinked. Every element may fit into one of the below-mentioned diagrams (A, B, C, D). Find out which group of elements correctly fits into the Below mentioned diagrams?

Find out that diagram which portrays the best relation between Tourists, Planes and Trains?

Options:

A

A

10.98%

B

B

9.81%

C

C

67.79%

D

D

11.42%

Since the Trains and Aeroplanes are the most common means to commute for the tourists and some tourists, prefer to travel via plane while the others via trains. Therefore since all there of them are interlinked.

Hence Option C will be the correct one.

3. Which of the below diagram signify the relationship between Men Fathers and Doctors?


<img class="alignnone size-full wp-image-259176" src="https://files.prepinsta.com/wp-content/uploads/2019/10/3-1.png" alt="" width="157" height="268" />

A

A

57.19%

B

B

20.94%

C

C

14.38%

D

D

7.5%

Since all men are fathers, but some fathers are Doctors.

Therefore Option A is the correct one.

4. Which one from the below-mentioned diagrams indicate the relation between Shopping Mall (SM, Designer Clothes (D)and Machinery (M)?

A

A

10.91%

B

B

48.83%

C

C

6.54%

D

D

33.72%

Although Designer wear and Machinery are different from each other. But both of them are found in the Shopping Mall.

Hence Option D is the correct one.

5. Given below are two statements, followed by two conclusions. Assuming that everything that’s mentioned in the statement is correct and reliable, decide which of the

Conclusion logically follow the information mentioned?

Statement:
A.) No Apples are Tangerine.
B.) No Tangerine is grapefruit.
Conclusion:
1.) Some Apples are Grapefruit
2.) Some Grapefruits are not Tangerine.

Only Conclusion I follows

Only Conclusion I follows

18.66%

Only Conclusion II follows

Only Conclusion II follows

26.33%

Either conclusion I or Conclusion II follows

Either conclusion I or Conclusion II follows

12.38%

Neither conclusion I nor Conclusion II follows

Neither conclusion I nor Conclusion II follows

42.63%

Here Since both, the above statements give a negative connotation. Therefore neither of the conclusion follows.

Therefore option D is the correct one.

6. Given below are two statements followed by two conclusions. Assuming that everything that’s mentioned in the statement is correct and reliable, decide which of the

Conclusion logically follow the information mentioned?
Statement:
A.) Some Sam is Tom
B.) Some, Harry is Sam.
Conclusion:
I.) Some Tom is Harry
II.) No Tom is Harry

Only Conclusion I follows

Only Conclusion I follows

24.9%

Only Conclusion II follows

Only Conclusion II follows

25.94%

Either conclusion I or Conclusion II follows

Either conclusion I or Conclusion II follows

30.13%

Neither conclusion I nor Conclusion II follows

Neither conclusion I nor Conclusion II follows

19.04%

By looking at the above diagram, it is clear that either conclusion I or conclusion II follow since the assumption is developing a matching couple.

Hence option C is the correct one.

7. Given below are two statements, followed by two conclusions. Assuming that everything that’s mentioned in the statement is correct and reliable, decide which of the
Conclusion logically follow the information mentioned?

Statement:
A.) Some Tigers are Rats
B.) No Hens are Tigers
Conclusion:
I.) No Tigers are Hens
II.) Some Rats are Hens

The only Conclusion I follows

The only Conclusion I follows

41.83%

Only Conclusion II follows

Only Conclusion II follows

12.3%

Either conclusion I or Conclusion II follows

Either conclusion I or Conclusion II follows

20.81%

Neither conclusion I nor Conclusion II follows

Neither conclusion I nor Conclusion II follows

25.06%


Since the first conclusion contains the middle term ‘puppy’ as the subject, and the second conclusion contains the central terms ‘puppy’ as the predicate. Since the conclusion I am particular, and conclusion II is negative. So, no conclusion follows.

8. Which of the following diagram describe the relationship between Hospital, Doctor, and Patient?

A

A

16.6%

B

B

31.98%

C

C

46.56%

D

D

4.86%

Which of the following diagram describe the relationship between Hospital, Doctor, and Patient?

9. Which of the following diagram describe the relationship between Director, Musician, and Actor?

A

A

69.59%

B

B

15.42%

C

C

8.78%

D

D

6.21%

A director may or may not be a musician or an actor. Similarly, an actor may or may not be a director or a musician, or a musician may or may not be an actor or director.

Therefore option A is the correct one.

10. Mentioned below are some statements followed by a conclusion in the options. Take the given statements to be accurate, even if they contradict to the commonly known facts, and determine the conclusions that logically follow the statements.
Statement:
1.) All boys are ladies.
2.) Some ladies are teachers
Conclusion:
I.) All ladies are boys
II.) Some ladies are not teachers.

only conclusion I follows

only conclusion I follows

10.66%

Only Conclusion II follows

Only Conclusion II follows

40.05%

Either conclusion I or Conclusion II follows

Either conclusion I or Conclusion II follows

17.77%

Neither conclusion I nor Conclusion II follows

Neither conclusion I nor Conclusion II follows

31.52%

Since both, the outcomes contain the term ladies so none of it can be tracked.

Hence option D is the correct one.

×

Please login to report

Also Check Out

Get over 200+ course One Subscription

Courses like AI/ML, Cloud Computing, Ethical Hacking, C, C++, Java, Python, DSA (All Languages), Competitive Coding (All Languages), TCS, Infosys, Wipro, Amazon, DBMS, SQL and others

Checkout list of all the video courses in PrepInsta Prime Subscription

Checkout list of all the video courses in PrepInsta Prime Subscription