Tips and Tricks and Shortcuts for Pie Charts

Pie Chart Tips and Tricks and Shortcuts

Here on this page Pie Chart Tips, Tricks and Shortcuts is given to solve the question easily and effectively. 

Pie Chart Tips, Tricks and Shortcuts :

Pie charts are a common type of data visualization used in data interpretation.

Here are some tips and tricks to solve pie chart questions:

  • Read the data in the pie chart carefully: If the distribution is given in percent, simply multiply this value to the total amount of data and then divide by 100 to get the actual value.
  • Remember that a whole circle contains 360 degrees: In a pie chart, each sector represents a certain percentage of the total data, which can be calculated using the formula: percentage of a data = (given data/total of all data) x 100.
  • Calculate the central angle of each sector using the formula: central angle of a data = (given data/total of all data) x 360 degrees.
  • Practice solving pie chart questions with solutions and explanations.

Uses of Pie Chart:

Pie charts are a type of chart used to represent fractions as parts of a whole. They are commonly used to compare data and analyze which data is bigger or smaller. Pie charts are preferred when dealing with discrete data.

Here are some uses of pie charts:

  • To show percentages of a whole.

  • To represent sample data with data points belonging to different categories.

  • To compare areas of growth within a business, such as turnover, profit, and exposure.

  • To represent categorical data.

  • To show the performance of a student in a test.

Prime Course Trailer

Related Banners

Get PrepInsta Prime & get Access to all 200+ courses offered by PrepInsta in One Subscription

Also Check Out

Tips and Tricks and Shortcuts for Pie Chart in DI

DIRECTIONS for Questions 1-5:

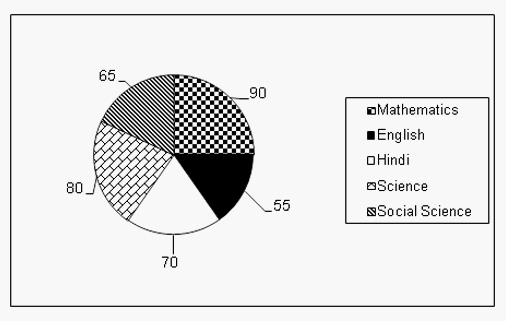
Refer to the pie chart given below and answer the questions that follow.
 
The given pie chart shows the marks scored by a students of G.D.Goenka School in different subjects- English, Hindi, Mathematics, Science and Social Science in an examination. The values given are in degrees.
 
Assumption: Total marks obtained in the examination are 900.
Line Graph Solved Examples

Question 1.

The difference of marks scored in Social Science and Science by students of G.D.Goenka School is

 
(a) 37.5
 
(b) 40
 
(c) 20
 
(d) 15
 
Explanation :
Angle of Science sector is 800and angle of Social Science sector is 650. So difference of angle is 150 .Difference of marks = (150 x 900 ) / 3600 = 37.5
 

Question 2.

What are total marks scored in Social Science and English by students of G.D.Goenka School?
 
(a) 300
(b) 350
(c) 400
(d) 450
 
Explanation:
 
Angle of English sector is 55and angle of Social Science sector is 650.So sum of angles is 1200.Sum of marks =( 1200 x 900) / 360 = 300.
 

Question 3.

If the marks scored by the student of G.D.Goenka School are 137.5, then the subject is
 
(a) English
(b) Hindi
(c) Mathematics
(d) Science
 
Explanation:
Going by the options, marks scored in English = 55 /360 x 900 = 137.5


Question 4.

If the total marks of student of G.D.Goenka School were 3000, then marks in Mathematics would be

(a) 800
(b) 750
(c) 850
(d) 900

Explanation:

Marks obtained in Mathematics would be = 90 / 360 x 3000 = 750

Question 5.

The Marks scored by the student of G.D.Goenka School in English and Mathematics is less than the marks scored in Science and Hindi by

(a) 5%
(b) 4.33%
(c) 3.33%
(d) 6%

Explanation:

Marks scored in English and Mathematics = (55 + 90 ) / 360 x 900 = 362.5
Marks scored in Hindi and Science = (70 + 80) / 360 x 900 = 375
Percent decrease = 12.5 / 375 x 100 = 3.33

Also Check Out

Get over 200+ course One Subscription

Courses like AI/ML, Cloud Computing, Ethical Hacking, C, C++, Java, Python, DSA (All Languages), Competitive Coding (All Languages), TCS, Infosys, Wipro, Amazon, DBMS, SQL and others

Checkout list of all the video courses in PrepInsta Prime Subscription

Checkout list of all the video courses in PrepInsta Prime Subscription