
 Apply For Jobs
 Get Hiring Updates
Tips and Tricks and Shortcuts To Solve Line Charts Questions


Questions and Answers for line Chart
Question 1.
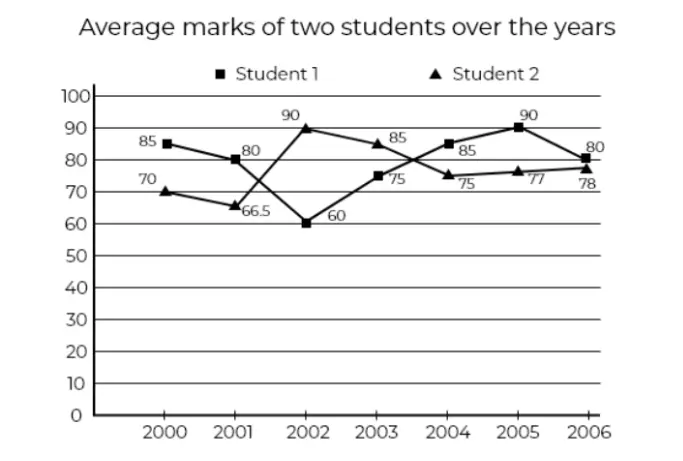
What percent is student 1’s average marks to that of student 2’s average marks in the 4th year
A. 88.2
B. 85.6
C. 90
D. 87.6
Answer : 88.2
Explanation :
In 2003, Student 1 = 75
Student 2 = 85
Required % = 75/85 * 100 = 88.2
Question 2 :
What is the ratio of the average marks of Student 1 over the years to that of Student 2?
A. 79.2 : 773
B. 792 : 773
C. 79 : 77
D. None of these
Answer : 792 : 773
Explanation :
Average marks of student 1 = (85 + 80 + 60 + 75 + 85 + 90 + 80)/7 = 79.2
Average marks of student 2 = (70 + 66.5 + 90 + 85 + 75+ 77 + 78)/7 = 77.3
Ratio = 79.2 : 77.3
Question 3 :
In which of the following years is the total marks maximum?
A. 2006
B. 2001
C. 2003
D. 2000
Answer : 2000
Explanation
Quicker Method: Since the number of subjects are the same, the total marks would be higher in the year whose average marks is the highest. Hence, 2000
Question 4 :
What would be the ratio of Student 1’s total average marks of the first and the last year to Student 2’s difference of marks in the first and last year
A. 9 : 10
B. 165 : 8
C. 8 : 165
D. 1
Answer : 165:8
Explanation :
Student 1’s total marks in 1st and last year = 85 + 80 = 165
Student 2’s difference in marks in 2st and last year = 78 – 70 = 8
Ratio = 165 : 8
Question 5 :
In which of the following years was the investment minimum for company B?
In which of the year the total marks is minimum for Student 2
A. 2004
B. 2005
C. 2003
D. 2002
Answer : 2004
Explanation :
Quicker Method: Since the number of subjects are the same, the total marks would be minimum in the year whose average marks is the lowest. Hence, 2004


Login/Signup to comment