


Formulas for Bar Charts
Formulas of Line Chart In Data Interpretation
Formulas for Bar Charts
A bar chart represents the data as horizontal or vertical bars. The length of each bar is proportional to the amount that it represents.
There are 3 main types of bar charts.
1. Vertical bar chart
2. Horizontal bar chart
3. Double bar chart
When constructing a bar chart it is important to choose a suitable scale to represent the frequency.


Common data Question from 1 to 3
The bar graph given below shows the sales of books (in thousand number) from six branches of a publishing company during two consecutive years 2000 and 2001.
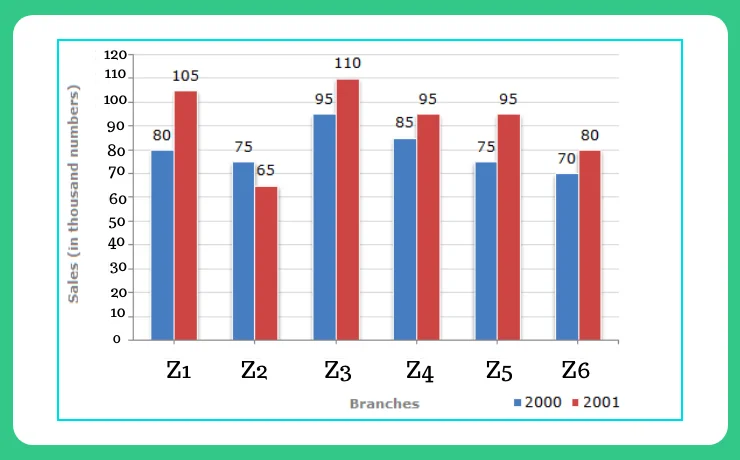
Sales of Books (in thousand numbers) from Six Branches – Z1, Z2, Z3, Z4, Z5 and Z6 of a publishing Company in 2000 and 2001.
Question1
What percent of the average sales of branches Z1, Z2 and Z3 in 2001 is the average sales of branches Z1, Z3 and Z6 in 2000?
Options
(A) 75%
(B) 77.5%
(C) 82.5%
(D) 87.5%
Explanations
Average sales (in thousand number) of branches Z1, Z2 and Z3 in 2001
\frac{1}{3} \ × (105 +65 + 110) = \frac{280}{3} \
Average sales (in thousand number) of branches Z1, Z3 and Z6 in 2000
\frac{1}{3} \ × (95 +80 + 70) = \frac{245}{3} \
∴ Required Percentage = \frac{\frac{245}{3}}{\frac{280}{3}} \times 100 %
= \frac{245}{280}\times 100 = 87.5%
Correct Options (D)
Question 2.
Total sales of branches Z1, Z3 and Z5 together for both the years (in thousand numbers) is?
Options
(A) 250
(B) 310
(C) 435
(D) 560
Total sales of branches Z1, Z3 and Z5 for both the years (in thousand numbers)
= (80 + 105) + (95 + 110) + (75 + 95)
= 560.
Correct Options (D)
Question 3.
What is the average sales of all the branches (in thousand numbers) for the year 2000 ?
Options
(A) 73
(B) 80
(C) 83
(D) 88
Explanations
Average sales of all the six branches ( in thousand numbers) for the year 2000
= \frac{1}{6}\times [ 80 + 75 + 95 + 85 + 75 + 70]
= 80
Correct Options (B)
Get over 200+ course One Subscription
Courses like AI/ML, Cloud Computing, Ethical Hacking, C, C++, Java, Python, DSA (All Languages), Competitive Coding (All Languages), TCS, Infosys, Wipro, Amazon, DBMS, SQL and others


Series
- Line Charts – Questions Formulas | How to Solve Quickly | Tricks & Shortcuts
- Pie Charts – Questions | Formulas | How to Solve Quickly | Tricks & Shortcuts
- Bar Charts – Questions | Formulas | How to Solve Quickly | Tricks & Shortcuts
- Radar Charts – Questions | Formulas | How to Solve Quickly | Tricks & Shortcuts


Series
- Line Charts – Questions
Formulas |
How to Solve Quickly |
Tricks & Shortcuts - Pie Charts – Questions |
Formulas |
How to Solve Quickly |
Tricks & Shortcuts - Bar Charts – Questions |
Formulas |
How to Solve Quickly |
Tricks & Shortcuts - Radar Charts – Questions |
Formulas |
How to Solve Quickly |
Tricks & Shortcuts
Login/Signup to comment