Here on this page you will get to learn about the Tips and tricks and shortcuts for Table Charts.
You will also find some rules and methods to solve Questions for Table chart.
Definition : Table charts are a fundamental tool for organizing and presenting data effectively. Whether you're a student preparing for exams, a professional analyzing business data, or simply someone who wants to improve their data presentation skills, this page offers valuable tips and tricks to make the most of table charts.
Tips and Tricks for Table Charts solution:
The points given below helps in solving table chart solutions :
Do not describe all the data presented – present the main points of each feature (you should make sure you mention each feature though)
Look for significant data; e.g. the highest, the lowest etc
Try and group the data. This may require you to use some general knowledge about the world, such as recognizing developed and developing countries
Note : Before creating a table chart, consider whether a table is the best format for your data. Tables excel at presenting structured, detailed information. If you need to showcase trends or comparisons, you may want to explore other chart types like bar charts, line charts, or pie charts.
Step by Step guide to solve Table chart :
Understand the Table Structure: Begin by carefully examining the table’s structure. Identify column headers, row labels, and any subheadings or categories.
Read the Questions First: Before diving into the table, read the questions associated with it. This will guide your focus and help you identify what specific information you need to extract or analyze.
Skim the Table: Start with a quick scan of the entire table to get a general sense of its content. Note any patterns, trends, or outliers that catch your eye during this initial scan.
Identify Relevant Rows and Columns: Once you’ve read the questions, pinpoint the rows and columns in the table that are directly related to the information required to answer those questions.
Focus on Key Values: Concentrate on the key values, numbers, or data points that directly address the questions. Avoid getting bogged down by irrelevant information.
Apply Filtering and Sorting: If the table is extensive, consider using filters or sorting features (if available) to narrow down the data or organize it in a way that facilitates your analysis.
Calculate and Summarize: If the questions involve calculations or summarizations (e.g., averages, totals, percentages), perform these operations systematically. Double-check your calculations to ensure accuracy.
To know more about formulas of Table chart click the link below .
Study the following table and answer the questions.
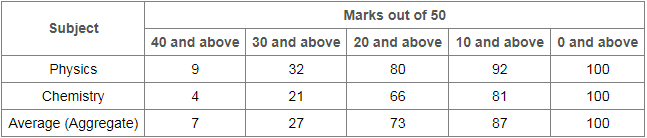
Classification of 100 Students Based on the Marks Obtained by them in Physics and Chemistry in an Examination.
Question 1.
If at least 70% marks in Physics are required for pursuing higher studies in Physics, how many students will be eligible to pursue higher studies in Physics?
Options
(A) 27
(B) 32
(C) 34
(D) 41
Answer:Option B
Explanation:
We have 70% of 50 = \frac{70}{100} \ * 50 = 35 \implies Required number
= No. of students scoring 35 and above marks in Physics
= 32
Question 2.
If it is known that at least 25 students were eligible for a Symposium on Chemistry, then the minimum qualifying marks in Chemistry for eligibility to Symposium would lie in the range?
Options
(A) 40-45
(B) 30-40
(C) 20-30
(D) Below 20
Answer:Option C
Explanation:
Since 66 students get 20 and above marks in Chemistry and out of these 21 students get 30 and above marks, therefore to select top 25 students in Chemistry, the qualifying marks should lie in the range 20-30.
Question 1
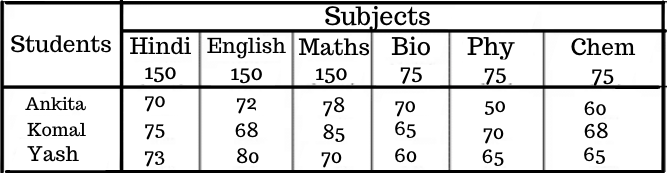
How many marks did Yash get in all Subject together ?