Question 1
In how many years the sale of printers is less than the sale of Laptops in the given years?
- Four
- Six
- Five
- Three
Answer: Option 1
Explanation:
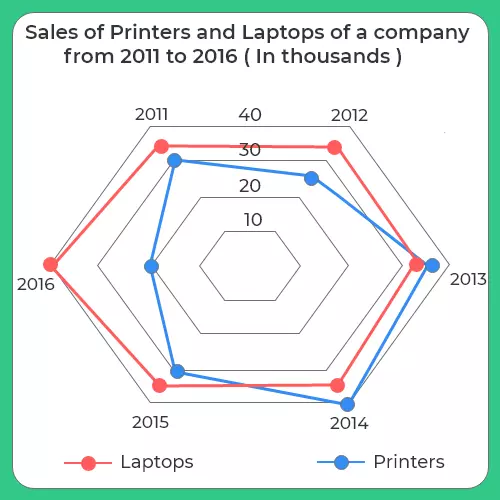
From the chart above it is clear that in 2011 the sale of printers was less than sale of laptops. Similarly, in 2012, 2015, and 2016 the sale of printers was less as compared to the sale of laptops. Therefore, in four years the sale was less.
Question 2
In which year there was maximum percentage increase in the sales for laptops?
- 2016
- 2012
- 2011
- 2015
Answer: Option 1
Explanation:
For laptop the sale in 2011 was 35 and in 2012 was 33. Therefore, the sale decreased. In 2012 was 33 and 2013 was also 33. Therefore, there was no change in the sale. In 2013 was 33 and 2014 was 35. Therefore, there was an increase by 2 thousand. Percent increase = 2/33 * 100 = 6.06%. In 2014 was 35 and 2015 was 36. So, there was increase of 1 thousand. Percent increase = 1/35 * 100 = 2.85%. In 2015 was 36 and 2016 was 40. Therefore, there was an increase of 4 thousand. Percent increase = 4/36 * 100 = 11.11%.
Thus, highest increase in the sale was in year 2016.
Question 3
In which year there was maximum percentage upsurge in the sales for printers?
- 2014
- 2012
- 2013
- 2016
Answer: Option 3
Explanation:
For printers the sale in 2011 was 30 and in 2012 was 25. Therefore, the sale decreased. In 2012 was 25 and 2013 was 37. Therefore, there was increase by 12 thousand. Percent increase = 12/25 * 100 = 48%. In 2013 was 37 and 2014 was 40. Therefore, there was an increase by 3 thousand. Percent increase = 3/37 * 100 = 8.10%. In 2014 was 40 and 2015 was 30. So, the sale decreased. In 2015 was 30 and 2016 was 20. Therefore, the sale decreased
Thus, highest increase in the sale was in year 2013.
Question 4
What is the proportion of total number of printers sold to the total number of laptops sold in all the years?
- 104 : 118
- 91 : 106
- 3: 7
- None of the above
Answer: Option 2
Explanation:
Total number of printers sold from 2011 to 2016 = 30 + 25 + 37 + 40 + 30 + 20 = 182
Total number of Laptop sold from 2011 to 2016 = 35 + 33 + 33 + 35 + 36 + 40 = 212
Therefore, ratio = 182/212 = 91:106
To Learn More about Formulas For Radar Charts go through the pages given below:


 Apply For Jobs
 Get Hiring Updates