Apply For Jobs
 Get Hiring Updates
Pie Chart Formulas


Pie Chart Formula Based Questions
Directions:
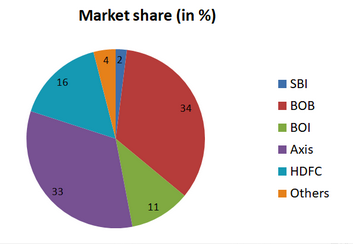
The following pie-chart shows the market share of different banks in India. Based on this pie-chart determine the questions given below.
Question 1.
If the value of the market share of BOI is Rs. 4000 crores, then the market share of BOB and Axis bank together is
A. 24,363 crores
B. 24,432 crores
C. 24,864 crores
D. 25, 827 crores
Explanation :
You can see that BOI accounts for 11 % of the market share. And this 11 % is equal to the 4000 crores. So to calculate the total market share of BOB and axis the formula will be, 67/11 x 4000 = 24,363. Thus, the correct answer is A.
Question 2.
If the total market share other than Axis and BOB is Rs. 335,000 crores. Then find the market share of BOI and HDFC banks.
A. 274,560 crores
B. 274,090 crores
C. 274,809 crores
D. Cannot be determined
Explanation :
Here, from the pie-chart, you can determine that the total market share of Axis and BOB in terms of percentage is 67 % and this is equal to Rs. 335,000. In addition to this the other banks that are left accounts for 33 % which equates to 35,000 crores. HDFC and BOI equal the market share of 27 %. Thus, their market share in terms of crores is 27 x 335000/33 => 274090 crores. So, the correct answer is C.
Question 3.
Find the approximate ratio of market share between BOI and BOB.
A. 1: 2
B. 3: 1
C. 1 : 3
D. Not possible
Explanation :
Take the market share of BOB and BOI and compare them both to find the ratio. As a result, the market share of BOB is given as 34 % and the market share of BOI is given as 11 %. So, the ratio of market share of BOI to a market share of BOB will be 11: 34. This will be close to 1 : 3. So, the correct answer is C.
Directions:
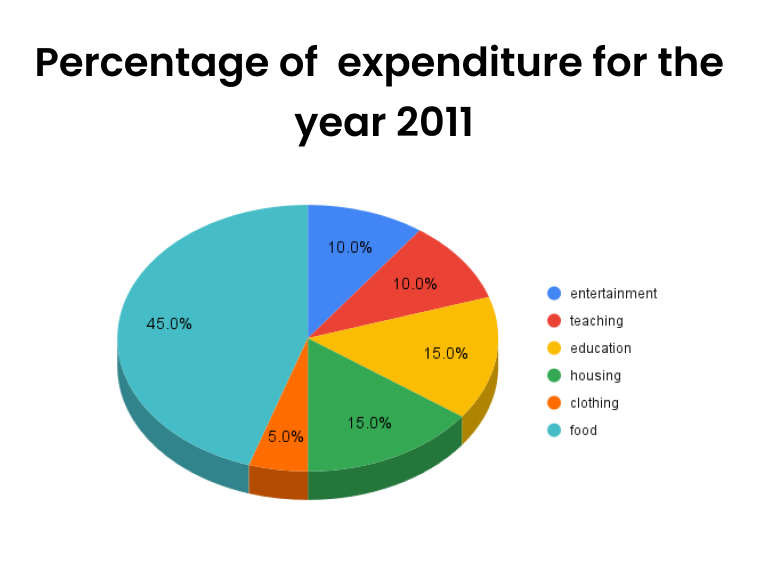
The pie chart given below shows the spending of Arvind Kejriwal’s family on different articles for the year 2011 according to data. Analyse the pie chart and answer the questions which follow.
Question 1.
If the total amount that was spent in the year 2011 was 50000 by Kejriwal’s family, the amount that was spent on food was
A. Rs.225000
B. Rs.22500
C. Rs.24000
D. Rs.21400
Explanation:
Amount spent on Food = 45% of Rs. 50000/- = Rs. 22500/-
Question 2.
If the total amount that was spent in the year 2011 was Rs. 48000 by Kejriwal’s family, the amount that was spent on housing and clothing combined was
A. Rs.9600
B. Rs.8000
C. Rs.10000
D. Rs.12000
Explanation:
Amount spent on Clothing and Housing together = (15% + 5% = 20%) of 48000 = Rs. 9600/-.