


How to Solve Radar Chart Questions Quickly
How to Solve Radar Chart Quickly
Radar Chart are a Useful way to display MultiVariate Observations.
Typically , Radar Charts are genertated in a Multi – Plot Format with many Stars on each Page and Each star Representing one Observation.
- Skip Unnecessary Calculations
- Read Questions Carefully
- Use Approximation if Needed otherwise can not Find
- Accuracy is the most Important thing While Solving Questions.
Application of Radar Chart
It is the Control of Quality improvement to display the Performance Matrices of any ongoing Program.
It is also used in Sports to Chart Players Strengths and Weakness , Where they are Usually Called Spider Charts.
Common Data Question for 1 to 3
Given Below is A Radar Chart for Sale of a Fan and Cooler of a Company from 1995 – 2000(in Thousands)
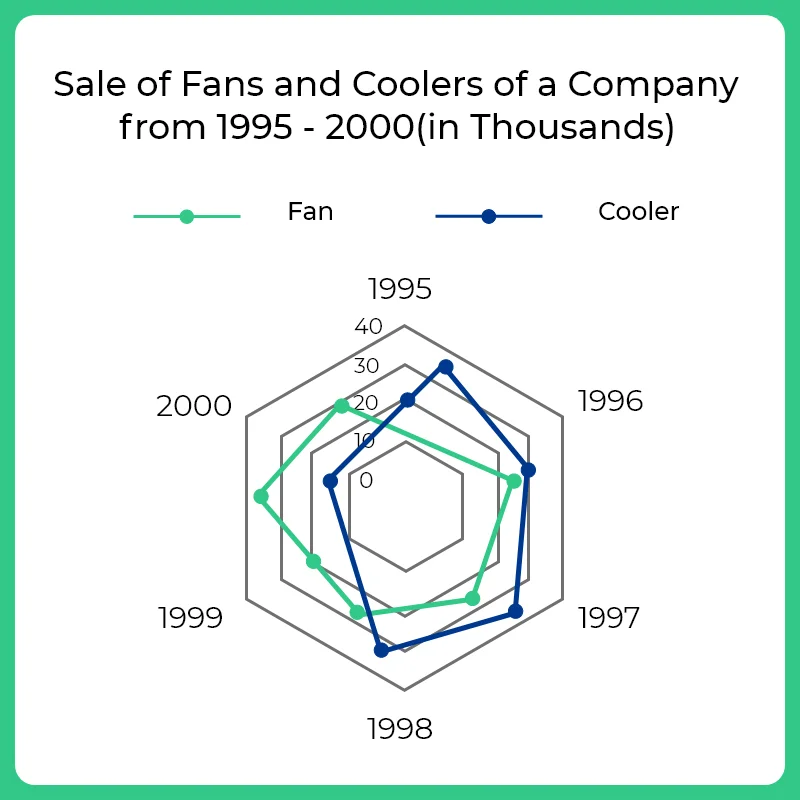
Question 1 What is the Sale of Cooler in 1995?
option 1 20,000
option 2 15, 000
option 3 22, 000
option 4 30,000
Solutions : Cooler is Represented by Blue.
After Selecting 1995 when we See in 1995 Sales is 20, 000
Question 2 What is the Sale of Fan in 1999?
option 1 15, 000
option 2 20,000
option 3 Can not Find
option 4 None
Solutions :
Fan is Represented by Green.
After Selecting 1999 when we See in 1999 Sales is 20, 000
Question 3 What is the Sale of Fan in 1997?
option 1 22, 000
option 2 32, 000
option 3 can not Find
option 4 31, 000
Solutions : In 1997 Number of sales of fan cant Find Exactly . So Can not Find will be Answer.
Read also:
Login/Signup to comment