How to solve Line Chart Quickly

Solve Linear Chart Quickly

Here, On this page you will get to learn about How to Solve Line Chart Quickly and easily with help of rules and formulas. 

A line chart is a type of graph used to visualize data points connected by straight lines. It’s commonly used to represent data that changes continuously over a period, such as time, to show trends, fluctuations, or patterns.

How to Solve Line Chart Questions Quickly

How to solve Line Charts Quickly

Concepts for Line Chart

  • Data Points: These are individual data values at specific points in time or along a continuous scale. Each data point consists of two values: the x-coordinate (horizontal position) and the y-coordinate (vertical position).

  • X-Axis: The horizontal axis represents the independent variable, typically time, a category, or a continuous scale.

  • Y-Axis: The vertical axis represents the dependent variable, which can be any numerical value.

  • Line Segments: Data points are connected by straight line segments, providing a visual representation of the data’s trend or pattern.

  • Trends: Line charts are used to identify trends over time or along the x-axis. An upward-sloping line indicates increasing values, a downward-sloping line suggests decreasing values, and a horizontal line represents no change.

Steps to extract information from Line Chart 

  • Step 1: Write the title of the graph.

  • Step 2 : Draw Both the Axis of the Graph.

  • Step 3 : Plot the Data Elements.

  • Step 4 : Plot Given Element Provided in Data.

  • Step 5 : Draw a Straight Line.

The Graph is ready.

Prime Course Trailer

Related Banners

Get PrepInsta Prime & get Access to all 200+ courses offered by PrepInsta in One Subscription

Questions and Answers to Solve for Line Chart quickly 

Answer the questions based on the given line graph.

line chart formulas

Question 1.

What would be the ratio of average runs of B in 1996 to the average runs of A in 1993?

A. 9 : 10
B. 10 : 9
C. 3 : 2
D. 15 : 13

Answer : 3:2
Explanation : 

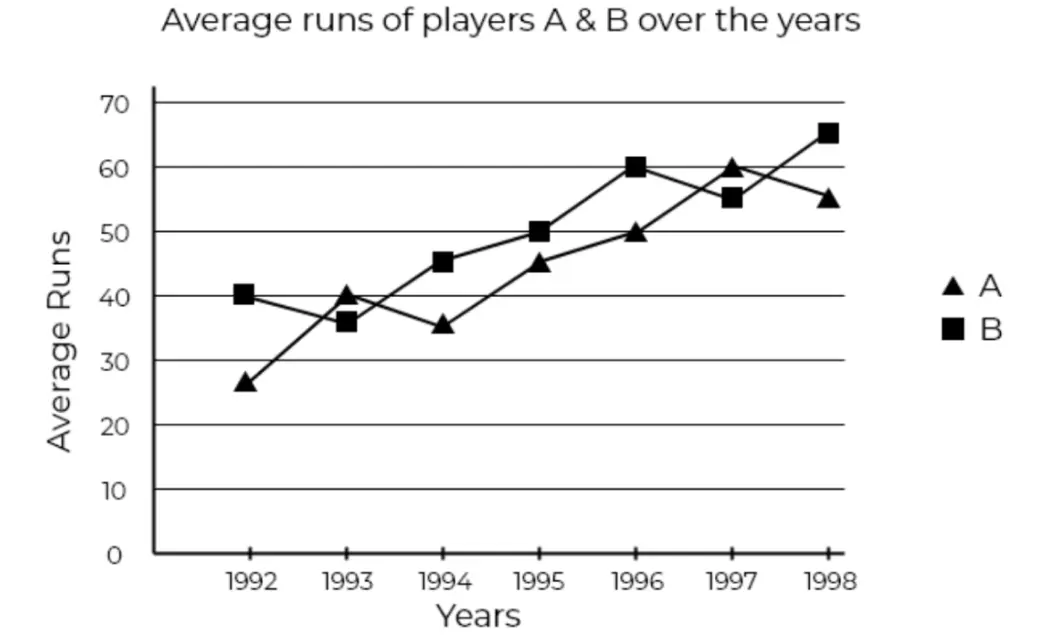
Average runs of B in 1996 = 60.
Average runs of A in 1993 = 40.
Required ratio = 60 / 40 = 3:2

Question 2 :

What would be the ratio of average runs of A in 1998 to the average runs of B in 1993?

A. 7 : 11
B. 11 : 7
C. 3 : 2
D. 15 : 13

Answer : 11:7
Explanation : 

Average runs of A in 1998 = 55.
Average runs of B in 1993 = 35.
Required ratio = 55 / 35 = 11:7

Question 3 : 

What percent A’s average run in 1995 is of B’s average run in 1998?

A. 68.2%
B. 70%
C. 67%
D. 69.2%

Answer : 69.2%
Explanation : 

Average runs of A in 1995 = 45
Average runs of B in 1998 = 65
Therefore, Required %= 45/65 * 100 = 69.2%

Question 4 :

The average runs of ‘B’ per year is what percentage of the average runs of ‘A’ per year?(approximately)

A. 70%
B. 110%
C. 113%
D. 90%

Answer : 113%
Explanation : 

Average runs of A = (25 + 40 + 35 + 45 + 50 + 60 + 55) / 7 = 44.285
Average runs of B = (40 + 35 + 45 + 50 + 60 + 55 + 65) / 7 = 50
Required % = 50 / 44.285 x 100 = 112.9% ≅ 113%

Question 5 :

Average runs of ‘A’ in 1996 is what percent of average runs of ‘B’ in 1992?

A. 75%
B. 63.64%
C. 133.33%
D. 125%

Answer : 125%
Explanation : 

Average runs of B in 1992 = 40.
Average runs of A in 1996 = 50.
Required % = 50/40 * 100 = 125 %

Get over 200+ course One Subscription

Courses like AI/ML, Cloud Computing, Ethical Hacking, C, C++, Java, Python, DSA (All Languages), Competitive Coding (All Languages), TCS, Infosys, Wipro, Amazon, DBMS, SQL and others

Checkout list of all the video courses in PrepInsta Prime Subscription

Checkout list of all the video courses in PrepInsta Prime Subscription