Line Chart Formulas

Formulas for Line Chart

Here , In this Page Formulas of Line Chart in Data Interpretation is given along with some questions and answers. 

A line graph is a graphical display of information that changes continuously over time. A line graph may also be referred to as a line chart. Within a line graph, there are points connecting the data to show a continuous change.

Formulas of Line Chart

Formulas for Line Chart

Types of Line Chart 

  • Data Series: In a line chart, data is represented as a series of data points, where each data point corresponds to a specific value at a particular point in time or along a continuous scale. These data points are connected by straight lines to form the chart.

  • X-Axis and Y-Axis: Line charts have two axes: the horizontal axis, known as the X-axis, and the vertical axis, known as the Y-axis. The X-axis typically represents the independent variable, such as time, while the Y-axis represents the dependent variable, which can be any numerical value.

  • Data Points: Each data point on the chart consists of a pair of values: one for the X-coordinate (horizontal position) and one for the Y-coordinate (vertical position). The X-coordinate is used to determine where the data point is plotted along the X-axis, while the Y-coordinate determines its position along the Y-axis.

  • Line Segments: The data points on the line chart are connected by line segments. These line segments provide a visual representation of the trend or pattern in the data. A continuous line typically suggests a smooth progression between data points.

  • Trends and Patterns: Line charts are particularly useful for visualizing trends in data. An upward-sloping line indicates increasing values over time or along the X-axis, while a downward-sloping line suggests decreasing values. A horizontal line suggests no change, and fluctuations in the line can reveal patterns or cycles in the data.

  • Title and Labels: A line chart typically includes a title and labels for both the X-axis and Y-axis to provide context and help the viewer understand the data being displayed.

How to make Line Chart? 

To draw a line chart you must follow these steps : 

  1. Use the data from the data-table to choose a suitable scale.
  2. Draw and label the scale on the vertical (y-axis) and horizontal (x-axis) axes.
  3. List each item and place the points on the graph.
  4. Join the points with line segments.
Line chart formulas

The above diagram shows the line graph of the average monthly rainfall of two cities (City 1 and City 2). 

We can extract information from the above line graph and answer the questions accordingly. 

Prime Course Trailer

Related Banners

Get PrepInsta Prime & get Access to all 200+ courses offered by PrepInsta in One Subscription

Question and Answers for Line Chart 

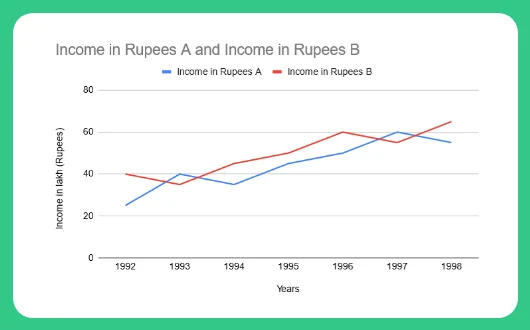
Study the following graph carefully and answer the questions given below (Profit is taken as the % of expenditure.)

Formulas of Line Chart Question 1

Question 1 : 

What would be the ratio of income of company B in 1996 to the income of company A in 1993?

A. 9 : 10
 
B. 10 : 9
 
C. 3 : 2
 
D. 15 : 13
 
Answer Option C
 
Solution
Income of Company B in 1996 = 60 lakh. Income of company A in 1993 = 40 lakh. Required ratio = \frac{60}{40} = 3:2


Question 2 :

If the expenditure of company B in 1997 is Rs. 50 lakhs, the percent profit earned by both the companies A and B in 1997 is equal, then what is the amount of profit earned by company A in 1997 (approximately)?
 
A. Rs. 5 lakhs
 
B. Rs. 4.5 lakhs
 
C. Rs. 5.5 lakhs
 
D. Rs. 6.2 lakhs
 
Answer Option C

Solution
Income of company B in 1997 = 55 lakh.
Expenditure of company B in 1997 = 50 lakh.

% profit = 10%
Expenditure = \frac{60}{1.1} = 54.5 ⇒ amount of profit = 60 – 54.5 = 5.5 lakh

Question 3 : 

If in the year 1995, company ‘B’ had a profit of 25%, what approximately was its expenditure in the year 1995 ?
 
A. Rs. 22 lakhs
 
B. Rs. 29 lakhs
 
C. Rs. 40 lakhs
 
D. Rs. 27 lakhs
 
Answer Option C
 
Solution
For company ‘B’ profit = 25%. Income of company B = 50 lakh in 1995
Required expenditure = \frac{50}{1.25} = 40 lakh

Question 4  :

What is the average of the income of A and B together in the years 19921 1993 and 1994?

A. 35

B. 36

C. 37

D. 48

Answer : 37

Solution: 

Income of A = 22 + 40 +38 = 100 

Income of B = 40 + 38 + 44 = 122

Average of income of A and B = (100 + 122 ) / 6 = 37

Question 5 : 

Calculate how much percent income of A was more or less than the income of B in the year 1996?

A. 12.32%

B. 13.25%

C. 14.25%

D. 16.66%

Answer : 16.66%

Solution : 

Income of A in 1996 = 50 

Income of B in 1996 = 60 

Clearly B has higher income.

Percentage less than B  = (10 / 60) * 100 

= 100/ 6 = 16.66%

Get over 200+ course One Subscription

Courses like AI/ML, Cloud Computing, Ethical Hacking, C, C++, Java, Python, DSA (All Languages), Competitive Coding (All Languages), TCS, Infosys, Wipro, Amazon, DBMS, SQL and others

Checkout list of all the video courses in PrepInsta Prime Subscription

Checkout list of all the video courses in PrepInsta Prime Subscription