


How to solve Pie Charts Quickly
Formulas of Line Chart In Data Interpretation
How to solve Pie Charts Quickly
Pie Chart in DI methods to solve the questions quickly :
- A pie chart is a type of graph in which a circle is divided into sectors that each represents a proportion of the whole.
- Pie charts are a useful way to organize data in order to see the size of components relative to the whole, and are particularly good at showing percentage or proportional data.
- While pie charts are popular data representations, they can be hard to read, and it can be difficult to compare data from one pie chart to another.
- Pie charts are a useful way to visualize information that might be presented in a small table.


How to Create a Pie Chart
- Start with what you want to illustrate. The main topic will be the title of your chart.
- Gather the data. Pie charts depict percentages. Make sure your percentages add up to 100% and get rid of any rounding issues that would make the total something other than 100%. SmartDraw allows you to write the percentage directly into a pie chart template or you can drag the edge of a wedge to make it bigger or smaller.
- Consider creating a legend. If a wedge is too small to hold text, you can create a label and draw a line identifying the appropriate slice. Alternatively, you can create a key that shows what each color represents.
How To Solve Pie Chart in Data Interpretation Questions Quickly
Directions to solve :
The following pie chart shows the amount of subscriptions generated for India Bonds from different categories of investors.
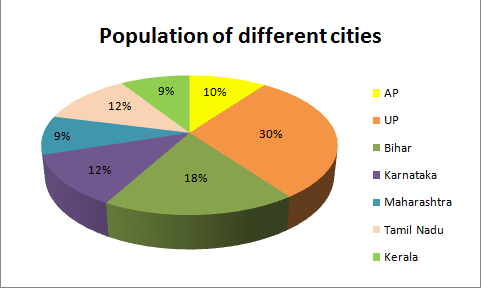
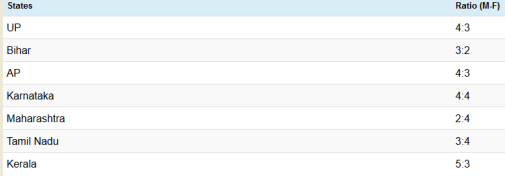
Question 1.Approximately what will be the percentage of total male in UP, AP and Tamil Nadu of the total population of the given states? |
(a.) 29 %
(b.) 25 %
(c.) 27 %
(d.) 28 %
Answer: Option D
Explanation:
Question 2.
Women of Andhra Pradesh is approximately what percentage of the women in Tamil Nadu ?
(a.) 65%
(b.) 63%
(c.) 53%
(d.) 58%
Explanation:
{( 3/7 * 10) / (4/7 * 12)} * 100
= 62.5
= 63%
Expenditure Incurred by Mr. Sharma on Various Heads in 2001 & 2002


Total salary = Rs. 1,20,000 p.a.


Total salary = Rs. 2,40,000 p.a.
Question 3.
How much more money does Mr Gupta spend on taxes than on transport in the year 2001?
(a.) Rs 9,200
(b.) Rs 8,370
(c.) Rs ,600
(d.) Rs 8,500
Explanation:
Money spent on Taxes =12%
Money spent on Transport =20%
Difference of Taxes and Transport:
= (12-20)/100 * 1,20,000
= Rs 9,600
Prime Course Trailer
Related Banners
Get PrepInsta Prime & get Access to all 200+ courses offered by PrepInsta in One Subscription
Get over 200+ course One Subscription
Courses like AI/ML, Cloud Computing, Ethical Hacking, C, C++, Java, Python, DSA (All Languages), Competitive Coding (All Languages), TCS, Infosys, Wipro, Amazon, DBMS, SQL and others


Series
- Line Charts – Questions Formulas | How to Solve Quickly | Tricks & Shortcuts
- Pie Charts – Questions | Formulas | How to Solve Quickly | Tricks & Shortcuts
- Bar Charts – Questions | Formulas | How to Solve Quickly | Tricks & Shortcuts
- Radar Charts – Questions | Formulas | How to Solve Quickly | Tricks & Shortcuts


Series
- Line Charts –
Questions
Formulas |
How to Solve Quickly |
Tricks & Shortcuts - Bar Charts –
Questions |
Formulas |
How to Solve Quickly |
Tricks & Shortcuts - Radar Charts –
Questions |
Formulas |
How to Solve Quickly |
Tricks & Shortcuts