
Elementary Statistics Questions and Answers


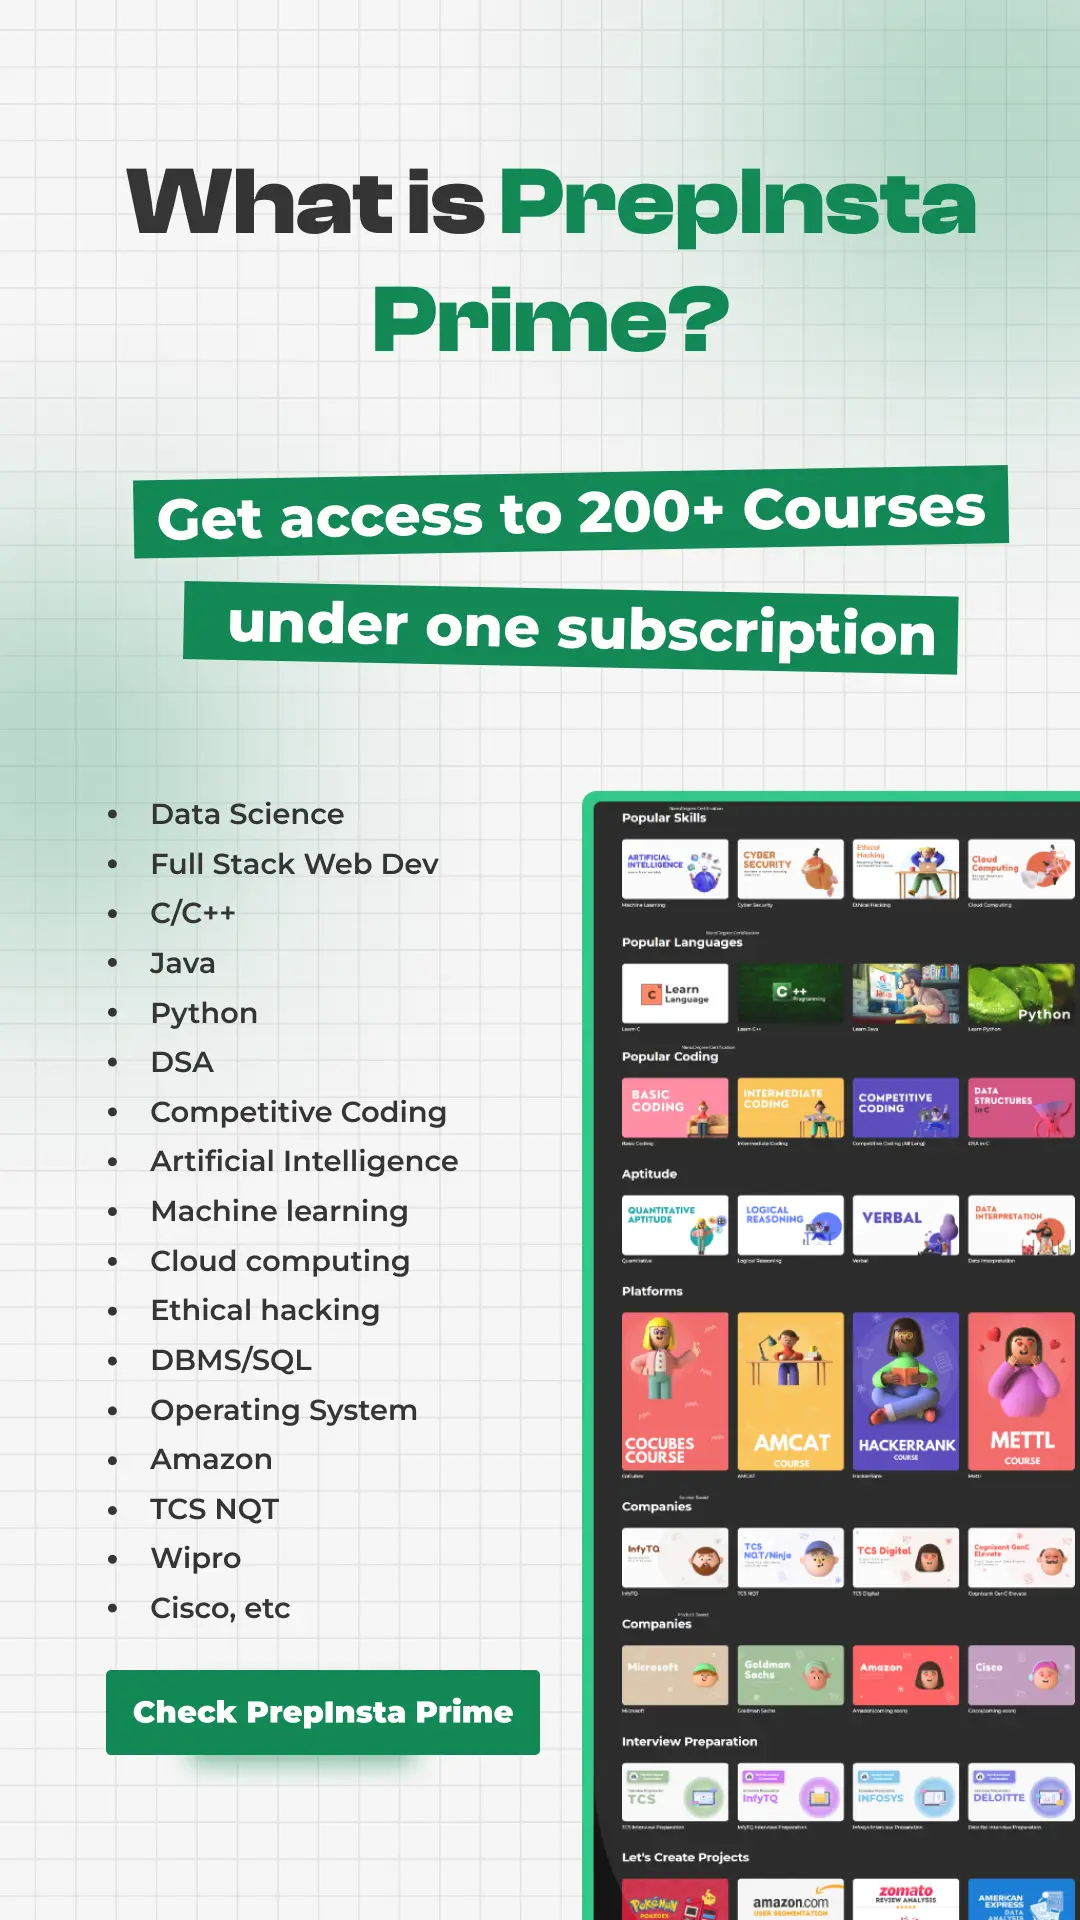
Get over 200+ Courses under One Subscription

One Subscription access everything
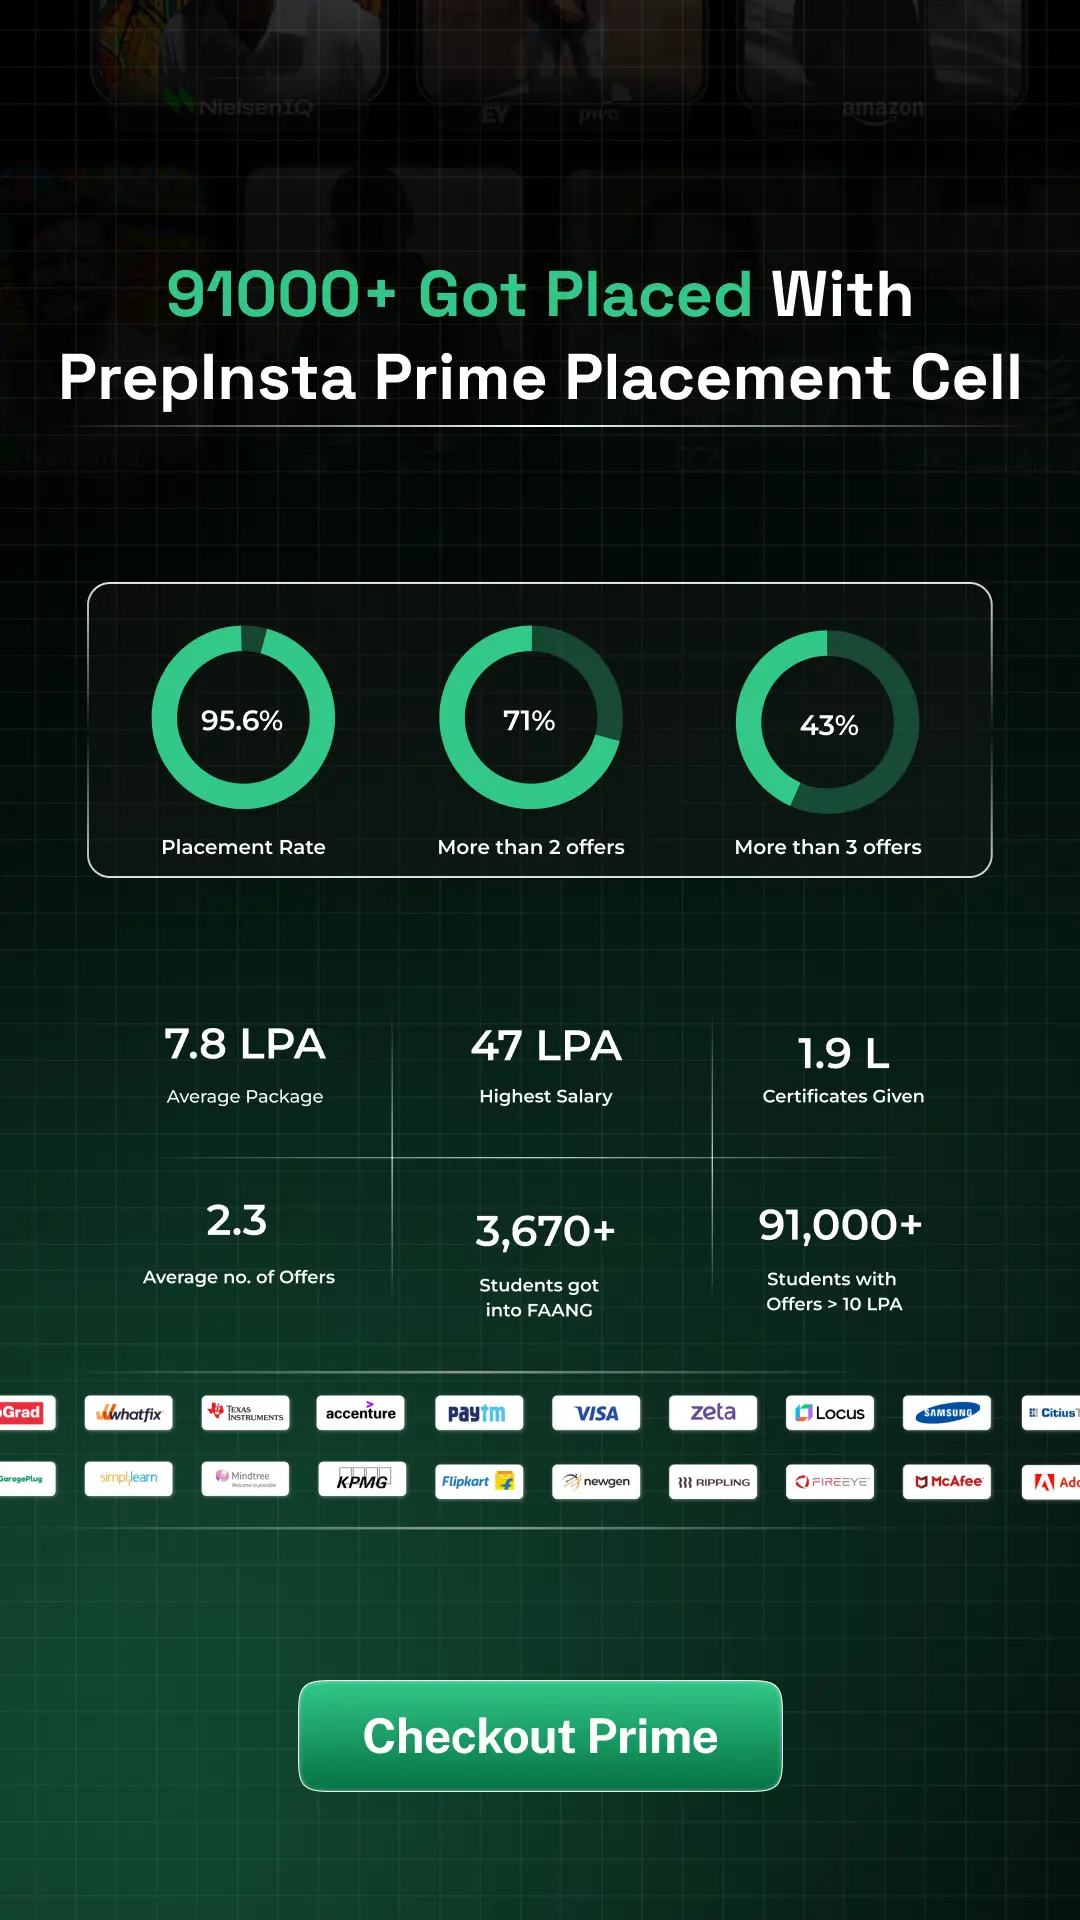
Get Access to PrepInsta Prime
from FAANG/IITs/TOP MNC's
Don’t settle Learn from the Best with PrepInsta Prime Subscription

Manish Agarwal
Ex- Accenture
Trained 3.2L+ students

Rushikesh Konapure
Data Science & Full Stack Mentor
Trained 35k+ students

Atulya Kaushik
Ex- Google & Instamojo
Trained 3.2L+ students

Aashay Mishra
Ex- Sapient
Trained 83k+ students

Janvi Jain
Lead Verbal Mentor
Trained 46k+ students

One Subscription, For Everything
The new cool way of learning and upskilling -
One Subscription access everything
Get Access to PrepInsta Prime
from FAANG/IITs/TOP MNC's
PrepInstaPrime
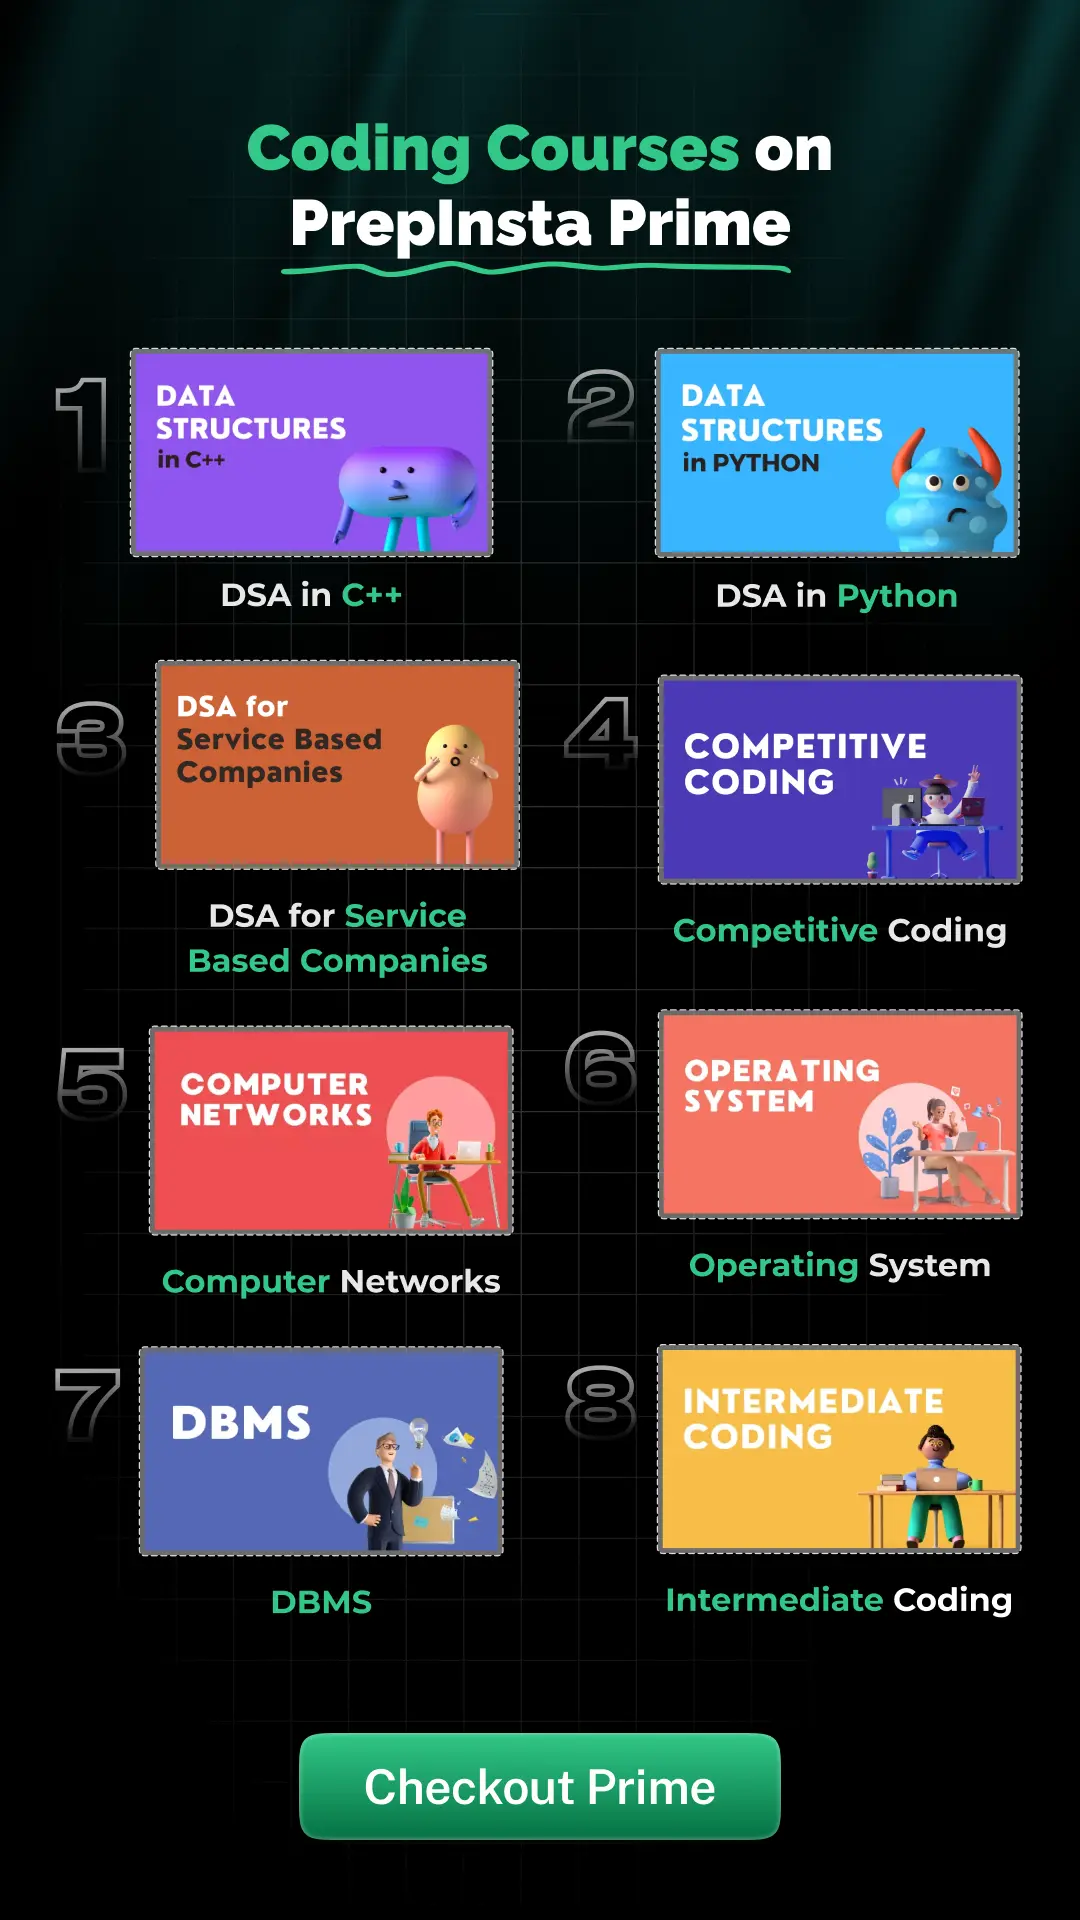
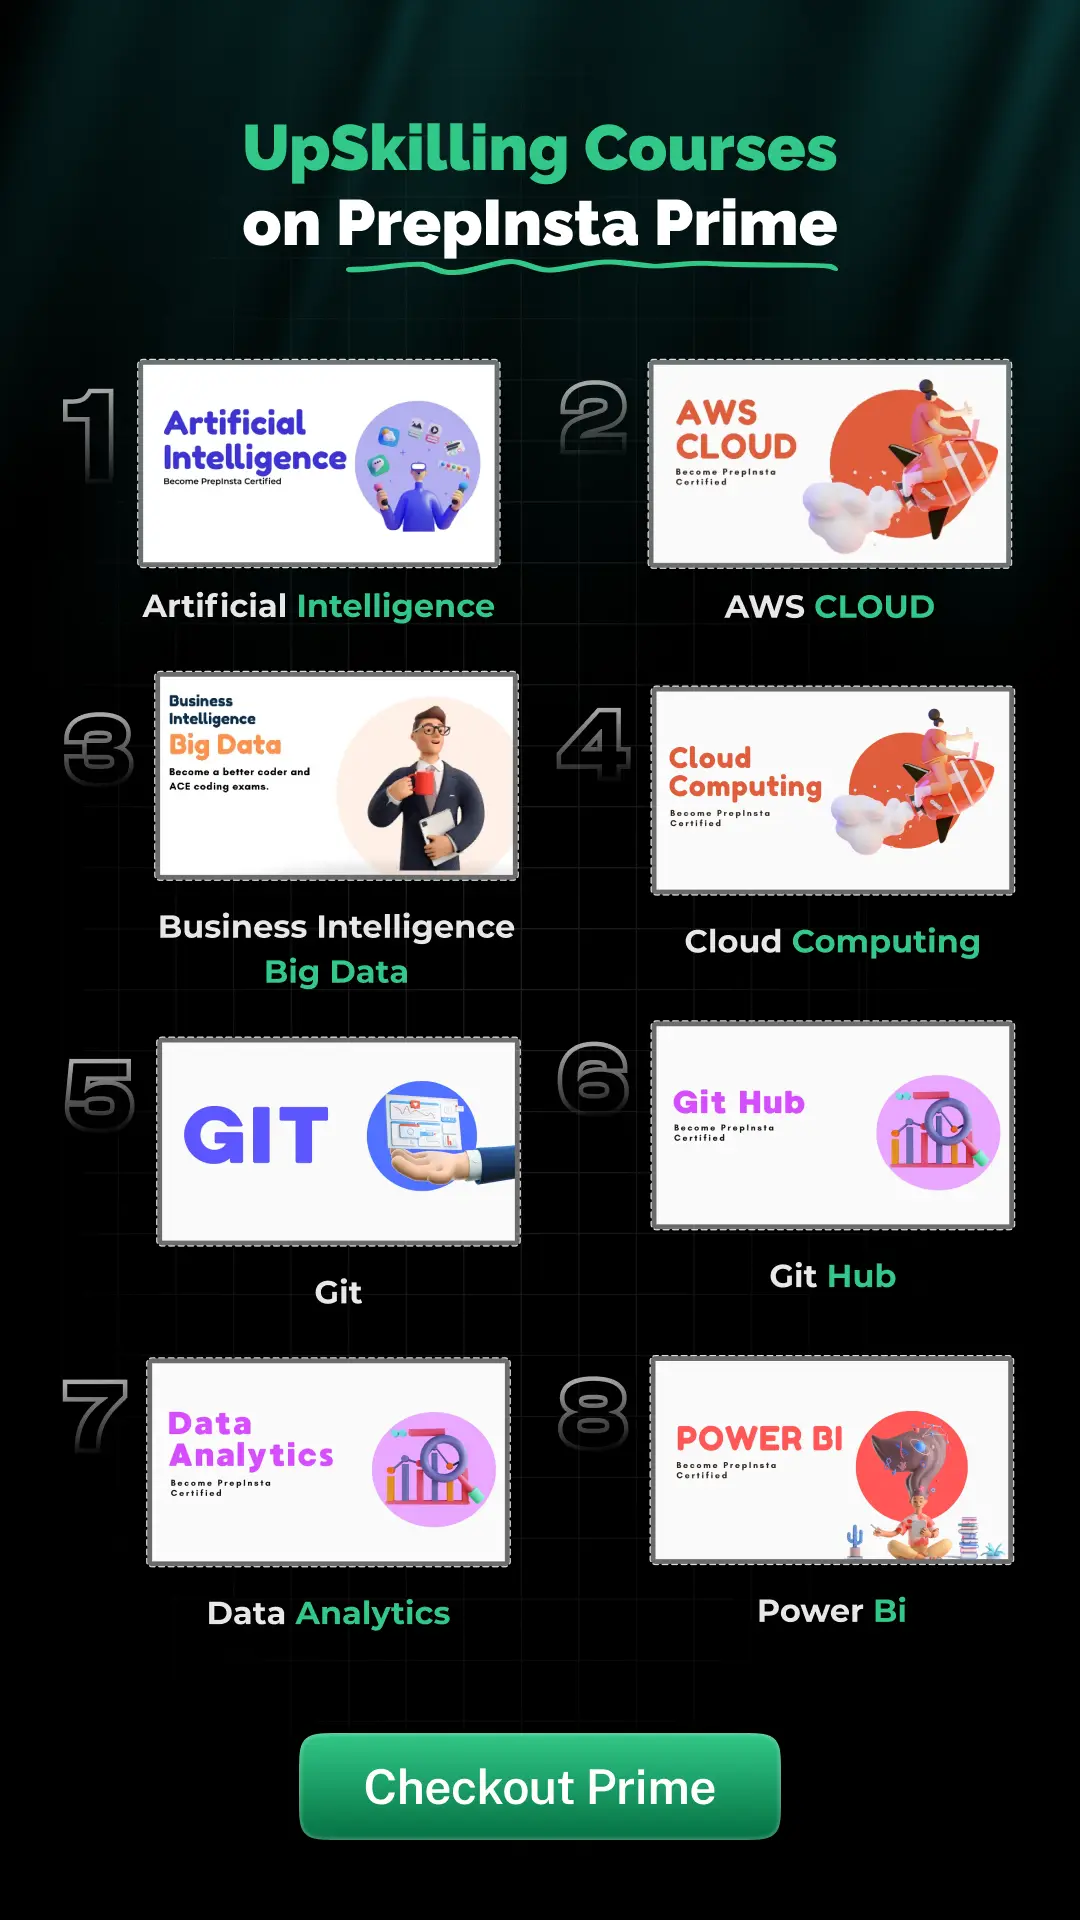
Get over 200+ course One Subscription
Courses like AI/ML, Cloud Computing, Ethical Hacking, C, C++, Java, Python, DSA (All Languages), Competitive Coding (All Languages), TCS, Infosys, Wipro, Amazon, DBMS, SQL and others.

