Bar Chart Questions and Answers

Bar Chart Questions and Answers

Here, In this Page you will find Bar Chart Questions and Answers along with some of its applications and types also. 

Pie Chart Questions and Answers

What is Bar Chart?

A bar chart is a graphical representation of data that uses rectangular bars or columns to represent different categories or values.

The rectangular bars are designed vertically or horizontally. A bar chart depicts a comparisons between different categories.

It included two axis: X axis and Y axis. One axis shows the precise categories being associated, and another axis shows the measured value.

Types of Bar Chart

There are several types of bar charts that can be used to represent data. Here are some of the most common types of bar charts:

  1. Vertical Bar Chart: This is the most commonly used bar chart. It represents the data vertically, with the bars running up and down the chart.
  2. Horizontal Bar Chart: This type of bar chart represents the data horizontally, with the bars running left to right.
  3. Stacked Bar Chart: In a stacked bar chart, the bars are divided into segments, each representing a different category. The segments are stacked on top of each other, with the total height of the bar representing the total value of all the segments.
  4. Grouped Bar Chart: In a grouped bar chart, the bars are divided into groups, with each group representing a different category. The bars within each group are side by side, making it easy to compare the values of each category. 

Below is an image of description of the Bar Chart 

The image given below shows the production and sales of a company for the month of March, April, May, and June. 
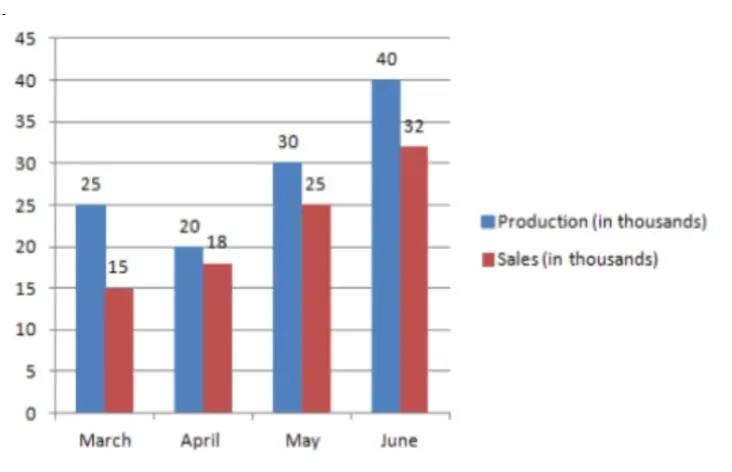
Bar chart questions and answers

Prime Course Trailer

Related Banners

Get PrepInsta Prime & get Access to all 200+ courses offered by PrepInsta in One Subscription

Also Check Out

Bar chart Questions and Answers 

1. The bar graph below provides the information about the sales of computers (in thousand number) from six different company during 2010 and 2011. Study the graph properly and answer all the given questions.

Find the ratio between total sales of company B and company D for the year 2010 and 2011.

4:5

4:5

74.31%

5:6

5:6

11.86%

7:11

7:11

7.51%

13:19

13:19

6.32%

Company B’s sale in 2010 = 85000

In 2011 = 75000

Company D’s sale in 2010 = 95000

In 2011 = 105000

Total sale of Company B = 85000 + 75000 = 160000

Total sale of Company D = 95000 + 105000 = 200000

Therefore, ratio = \frac{160000}{200000} = \frac{4}{5} = 4:5

2. The bar graph below provides the information about the sales of computers (in thousand number) from six different company during 2010 and 2011. Study the graph properly and answer all the given questions.

Total sales of company F is what percent of company C’s total sales for both 2010 and 2011 together?

72.12%

72.12%

11.09%

73.6%

73.6%

12.44%

75.5%

75.5%

69.23%

81%

81%

7.24%

Company F’s sale in 2010 = 80000

In 2011 = 90000

Company C’s sale in 2010 = 105000

In 2011 = 120000

Total sale of company F = 80000 + 90000 = 170000

Total sale of company C = 105000 + 120000 = 225000

Percentage = \frac{170000}{225000} \times 100 = 75.5%

3. The bar graph below provides the information about the sales of computers (in thousand number) from six different company during 2010 and 2011. Study the graph properly and answer all the given questions.

What percentage of average sale of all 6 companies in 2011 is the average sale in 2010?

81.2%

81.2%

10.46%

88.5%

88.5%

56.03%

92.6%

92.6%

11.8%

None of the above

None of the above

21.72%

Average of all the six companies in 2010 = \frac{90 + 85 + 105 + 95 + 85 + 80}{6}

=\frac{540}{6} = 90

Average of all the six companies in 2011 = \frac{115 + 75 + 120 + 105 + 105 + 90}{6}

= \frac{610}{6} = 101.66

Percentage = \frac{90}{101.66} \times 100 = 88.5%

4. The bar graph below provides the information about the sales of computers (in thousand number) from six different company during 2010 and 2011. Study the graph properly and answer all the given questions.

Find the average sale of company A, C, and F for the year 2011.

107.69

107.69

14.01%

102.3

102.3

13.46%

102.3

102.3

3.85%

108.3

108.3

68.68%

In 2011 the sale of company A, C, and F were: 115 + 120 + 90 = 325

Therefore, the average = \frac{325}{3} = 108.33

5. The bar graph below provides the information about the export of a country (in million $) from the year 2001 to 2009. Study the graph properly and answer all the given questions.

Find the ratio of the years, in which the export was above the average to those in which the export was below the average.

3:5

3:5

60.65%

5:3

5:3

24.19%

6:7

6:7

8.71%

9:10

9:10

6.45%

The average of the export is: \frac{3052 + 4165 + 2950 + 3722 + 3500 + 4780 + 5460 + 3500}{8} = 3891.12

Those years in which the export was above 3891.12 were: 2002-03, 2006-07, and 2007-08. Therefore, for 3 years

Those years in which the export was below 3891.12 were: 2001-02, 2003-04, 2004-05, 2005-06, and 2008-09. Therefore, for 5 years.

Thus the ratio is 3:5

6. The bar graph below provides the information about the export of a country (in million $) from the year 2001 to 2009. Study the graph properly and answer all the given questions.

The export of 2007-08 was how many times the export in 2004-05?

1.21

1.21

11.36%

1.69

1.69

19.16%

1.46

1.46

60.71%

None of the above

None of the above

8.77%

The export of 2007-08 was 5460

The export of 2004-05 was 3722

The ratio = \frac{5460}{3722} = 1.46

Therefore, the export of 2007-08 was 1.46 times the export in 2004-05.

7. The bar graph below provides the information about the export of a country (in million $) from the year 2001 to 2009. Study the graph properly and answer all the given questions.

Find the year in which, the percent upsurge of export over the preceding year, was the lowest?

2002-03

2002-03

17.93%

2007-08

2007-08

48.97%

2004-05

2004-05

20%

2006-07

2006-07

13.1%

The upsurge in export was in the year: 2002-03, 2004-05, 2006-07, and 2007-08.
The increase in export compared to previous year:
For 2002-03 = \frac{4165-3052}{3052} \times 100
= 36.46%
For 2004-05 = \frac{3722-2950}{2950} \times 100
= 26.16%
For 2006-07 = \frac{4850-3500}{3500} \times 100
= 38.57%
For 2007-08 = \frac{5460-4780}{4780} \times 100
= 14.22%
According to the above calculations it is clear that the percent upsurge of export over the preceding year was lowest in the year 2007-08.

8. The bar graph below provides the information about the export of a country (in million $) from the year 2001 to 2009. Study the graph properly and answer all the given questions.

Find the percentage increase in the export in 2007-08 over 2003-04.

89.6%

89.6%

10.81%

86.3%

86.3%

17.37%

85.08%

85.08%

61.39%

Data inadequate

Data inadequate

10.42%

The export of 2007-08 was 5460

The export of 2003-04 was 2950

Therefore, increase = 5460 – 2950 = 2510

Thus, percent increase = \frac{2510}{2950} \times 100 = 85.08%

9. The bar graph below provides the information about the manufacturing of furniture (table) by three different companies A, B, and C. (in thousand numbers) from the year 1985 to 1989. Study the graph properly and answer all the given questions.

Among the following years below, in which year the percentage rise/fall in manufacturing compared to the previous year is the maximum for Company B?

1986

1986

35.19%

1987

1987

17.07%

1988

1988

11.85%

1989

1989

35.89%

The percent change in the manufacturing of furniture by company B from the previous year:

For 1986 = \frac{50-40}{40} \times 100 = 25%

For 1987 = \frac{50-50}{50} \times 100 = 0%

For 1988 = \frac{55-50}{50} \times 100 = 10%

For 1989 = \frac{65-55}{55} \times 100 = 18.18%

Therefore, the minimum increase/fall was in the year 1986.

10. The bar graph below provides the information about the manufacturing of furniture (table) by three different companies A, B, and C. (in thousand numbers) from the year 1985 to 1989. Study the graph properly and answer all the given questions.

Find the company in which the average production was minimum.

Company C

Company C

14.61%

Company B

Company B

60.3%

Company A

Company A

15.73%

Both B and C

Both B and C

9.36%

For company A the average production was: \frac{45 + 60 + 40 + 65 + 55}{5} = 53

For company B the average production was: \frac{40 + 50 + 50 + 55 + 65}{5} = 52

For company C the average production was: \frac{50 + 55 + 60 + 50 + 50}{5} = 53

Therefore, the average production was minimum for company B

×

Please login to report

Also Check Out

Get over 200+ course One Subscription

Courses like AI/ML, Cloud Computing, Ethical Hacking, C, C++, Java, Python, DSA (All Languages), Competitive Coding (All Languages), TCS, Infosys, Wipro, Amazon, DBMS, SQL and others

Checkout list of all the video courses in PrepInsta Prime Subscription

Checkout list of all the video courses in PrepInsta Prime Subscription