
 Apply For Jobs
 Get Hiring Updates
MyAnatomy Data Interpretation Questions and Answers 2025
MyAnatomy DI Papers
On this page MyAnatomy Data Interpretation Questions and Answers you will find the questions and Answers asked frequently in the exams held by MyAnatomy. MyAnatomy is one of the largest online platforms in India. You will be asked to answer questions within a given amount of time. You will get all the information as well as the previous year's sample papers here.
Note:- MyAnatomy is a platform used by companies to conduct their exams. The number of Questions and Time duration may vary depending upon the criteria of the company for which the exam is being held.
Sections
4
Time duration
Depends on Compony

Adaptive / Non Adaptive
Depends on Compony

Negetive Marking
Yes

MyAnatomy Data Interpretation Curriculum
MyAnatomy Data Interpretation Questions and Answers
10 questions are asked in the DI section within a definite time period. The questions require you to be good at analyzing numbers and charts/tables. So always be attentive while solving them. Questions usually are of easy - medium level, but may consume your time. So you need to be able to solve this questions faster
Line Charts
Line chart or line graph is a form of chart that shows data or statistics as a sequences of individual data points recognized as ‘markers’ which are connected through straight lines. It displays quantitative values for a specific period of time. It included two axis: X and Y, displaying horizontally and vertically and usually denoted as (x,y). It also allows the user to visualize the trends and helps them in making analyses.
Pie Charts
A pie chart is a circular shaped geometrical visual graphic that exhibits data, information, figures, and statistics in the format of an easy-to-read ‘pie-slice’ with fluctuating sizes describing how much one data component exists. The larger the part, the more of that precise data were grouped
Bar Graph
A bar chart is a chart or graph which shows definite data presented in a form of rectangular bars along with lengths and heights proportionate to the presented data and statistics. The rectangular bars are designed vertically or horizontally. A bar graph depicts a comparisons between different categories. It included two axis: X axis and Y axis. One axis shows the precise categories being associated, and another axis shows the measured value
Radar Graph
A radar chart is used to graphically represent differences between actual and ideal performance or to show different data in two-dimensional form chart of two or more measurable variables symbolized on the axes beginning from the same point. This chart is also known by various names such as web-chart, spider chart, star plot, cobweb chart etc. Radar chart helps in quick visualization of quality data and large number of variables.


MyAnatomy DI Analytics 2025
MyAnatomy Data Interpretation overall analysis

Sub topic wise Analysis
Line Chart
Questions 2 - 5 (Depending on Company)
Pie Chart
Questions 2 - 5 (Depending on Company)
Bar Chart
Questions 1 - 5 (Depending on Company)
Radar Charts
Questions 0 - 3 (Depending on Company)

Get over 200+ Courses under One Subscription


One Subscription access everything
Get Access to PrepInsta Prime
from FAANG/IITs/TOP MNC's
Don’t settle Learn from the Best with PrepInsta Prime Subscription

Manish Agarwal
Ex- Accenture
Trained 3.2L+ students

Rushikesh Konapure
Data Science & Full Stack Mentor
Trained 35k+ students

Atulya Kaushik
Ex- Google & Instamojo
Trained 3.2L+ students

Aashay Mishra
Ex- Sapient
Trained 83k+ students

Janvi Jain
Lead Verbal Mentor
Trained 46k+ students


One Subscription, For Everything
The new cool way of learning and upskilling -
One Subscription access everything
Get Access to PrepInsta Prime
from FAANG/IITs/TOP MNC's
PrepInstaPrime
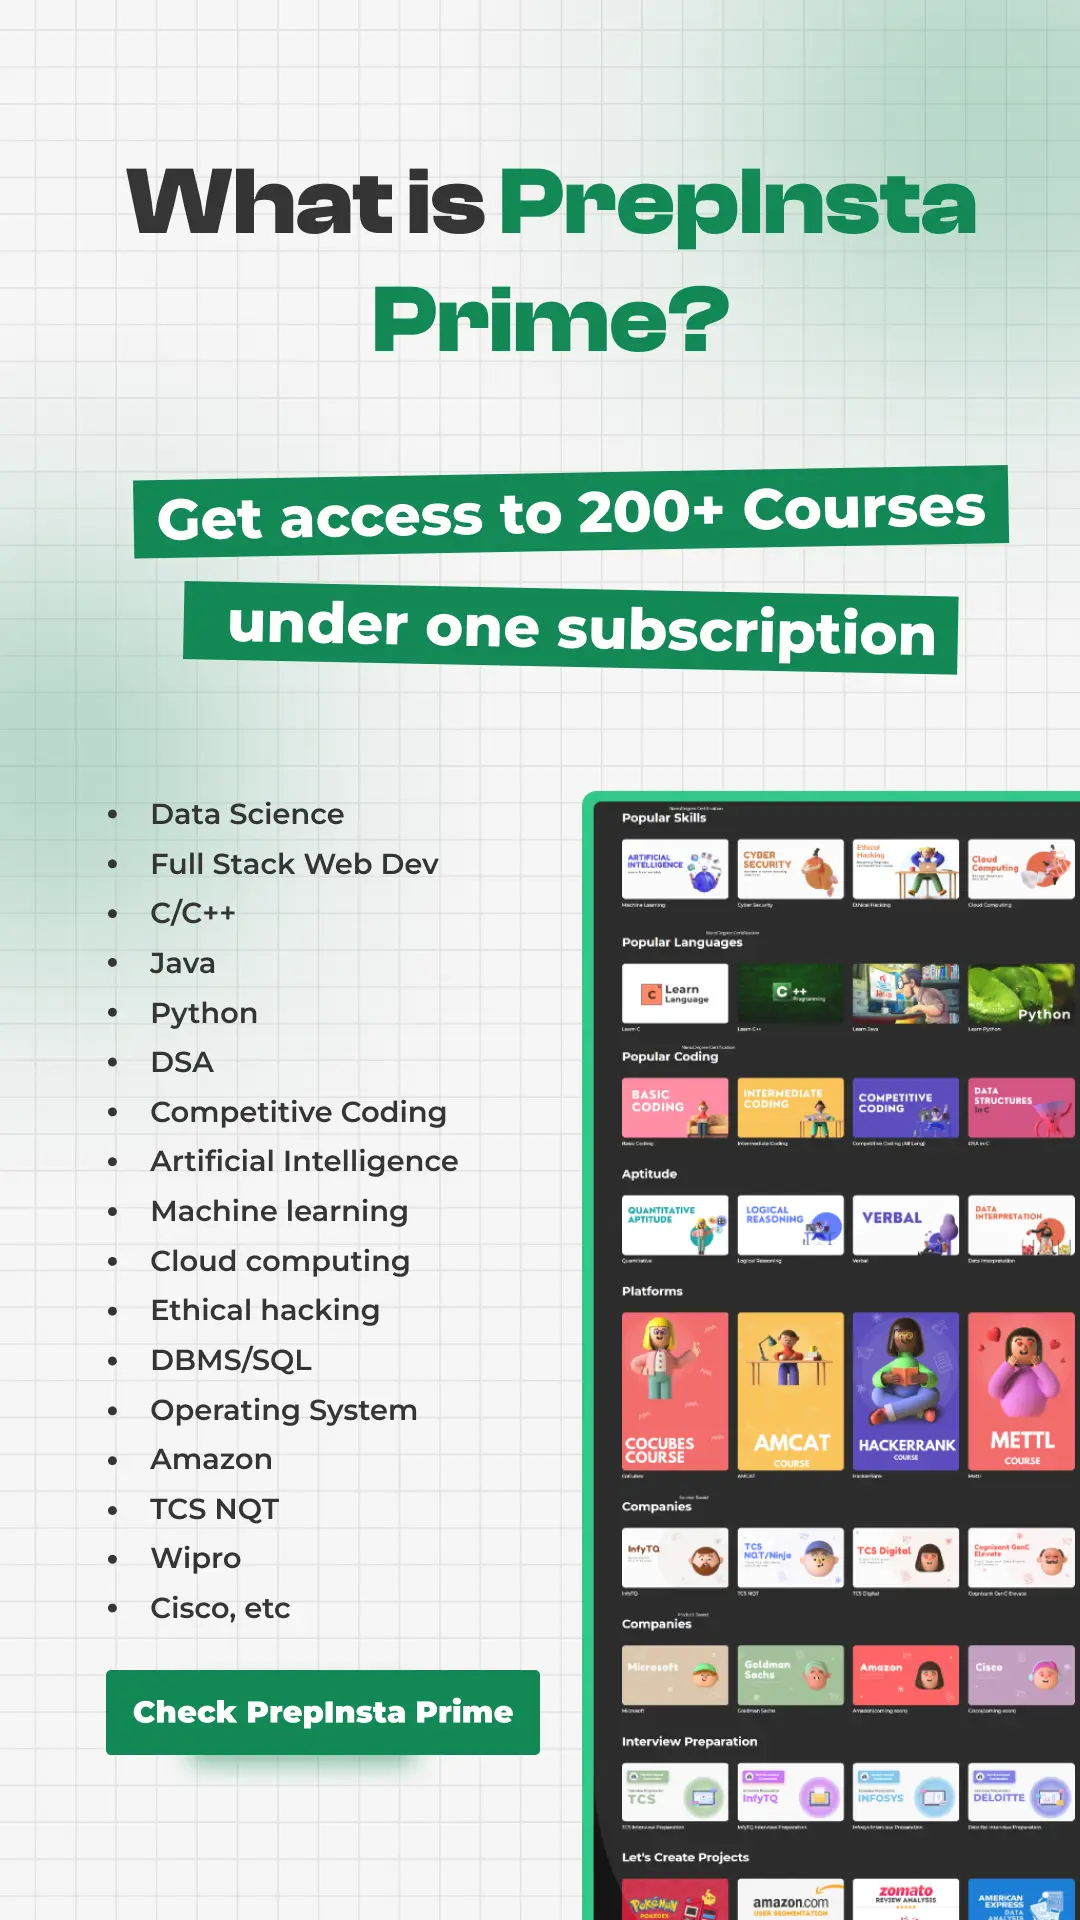
Get over 200+ course One Subscription
Courses like AI/ML, Cloud Computing, Ethical Hacking, C, C++, Java, Python, DSA (All Languages), Competitive Coding (All Languages), TCS, Infosys, Wipro, Amazon, DBMS, SQL and others.


Login/Signup to comment