
Data Analytics and Visualization
Key Insights into Data Analytics and Visualization
In this page you find out detailed insights on Data analytics and Visualization, which are powerful tools used to extract meaningful insights from raw data.Go through this page to find out how data analytics and visualization works and how they are different from each other.

Basic Idea Behind Data Analytics
- The basic idea behind data analytics is to examine raw data to find useful information, patterns, or trends.
- It’s like solving a puzzle where you use data to answer questions, make better decisions, or predict what might happen in the future.
In Depth Insights on Data Analytics
Data Analytics refers to the process of examining, cleaning, and interpreting raw data to uncover useful information, patterns, and trends. It helps businesses and organizations make data-driven decisions, identify opportunities, and solve problems.
Types of Data Analytics:
- Descriptive Analytics: Summarizes historical data to understand what happened.
- Diagnostic Analytics: Analyzes data to find out why something happened.
- Predictive Analytics: Uses historical data and algorithms to predict future outcomes.
- Prescriptive Analytics: Suggests actions to take based on data insights.
Workflow of Data Analytics
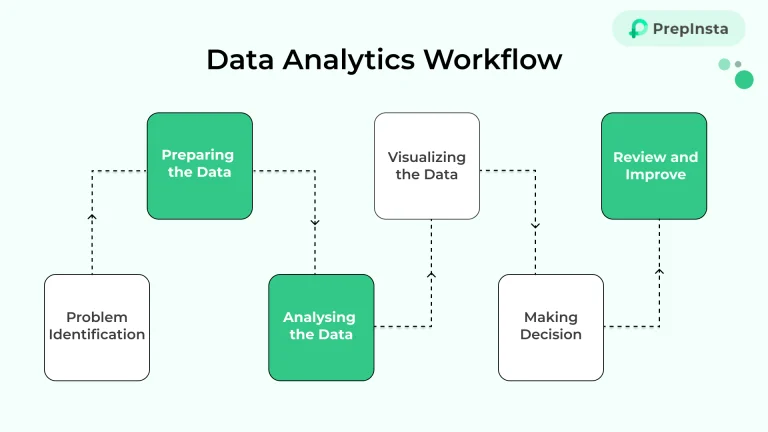
1. Problem Identification
- Start by identifying the question or issue you want to solve.
- Example: “Why is customer retention declining?”
2. Preparing the data
- Collect relevant data from various sources (surveys, databases, etc.).
- Clean and organize the data by fixing errors, removing duplicates, and filling missing values.
3. Analyzing the data
- Analyze and explore the data to identify patterns, trends, or anomalies.
- Use tools like Excel or Python to summarize key points.
4. Visualizing the data
- Perform deeper analysis using statistical models, algorithms, or machine learning.
- Example: Predict customer behavior based on purchase history.
5. Making decision
- Create visual representations (charts, graphs, dashboards) to simplify complex insights.
- Tools: Tableau, Power BI, or Excel.
6. Review and Improve
- Use the insights to solve problems or improve processes.
- Example: Launch a loyalty program to retain customers and increase sales.
Basic Idea Behind Data Visualization
- Data visualization is about showing information using pictures like graphs, charts, or maps to make it easy to understand.
- It helps people see patterns and trends in data quickly without looking at complicated numbers.
In Depth Insights on Data Visualization
Data Visualization involves representing data in a graphical or visual format, such as charts, graphs, and dashboards. It makes complex data easier to understand and communicate to stakeholders.
Types of Data Visualization:
- Charts and Graphs: Includes bar charts, line graphs, and pie charts.
- Dashboards: Combines multiple visualizations for an interactive overview.
- Heatmaps: Highlights patterns and trends using color gradients.
- Scatter Plots: Displays relationships between variables.
Workflow of Data Visualization
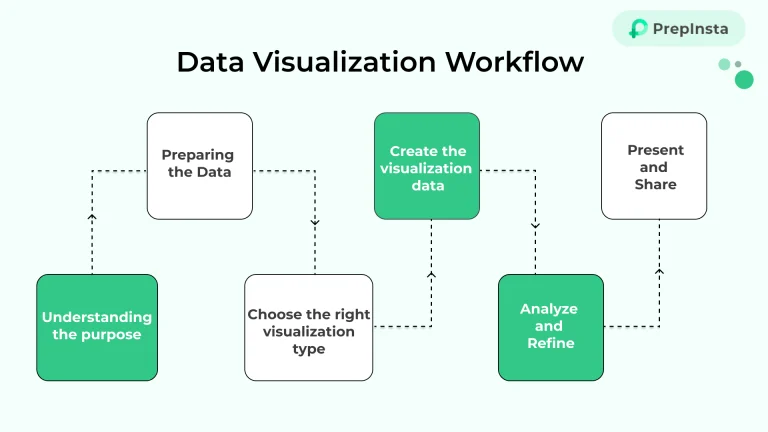
1. Understand the Purpose
- Identify what you want to show or explain with your data.
- Example: “What are the sales trends over the past year?”
2. Prepare the Data
- Collect and clean the data to ensure accuracy.
- Organize it in a format suitable for visualization (e.g., tables or spreadsheets).
3. Choose the Right Visualization Type
- Select a visual format that best represents your data.
- Example: Use a line chart for trends, a bar chart for comparisons, or a pie chart for proportions.
4. Create the Visualization
- Use tools like Excel, Tableau, or Power BI to design the chart or graph.
- Ensure it is clear, simple, and visually appealing.
5. Analyze and Refine
- Review the visualization to ensure it conveys the message correctly.
- Adjust for readability, like adding labels or changing colors for clarity.
6. Present and Share
- Share the visualization with others to explain the insights.
- Example: Include it in a report, dashboard, or presentation.
How Data Analytics and Visualization Work Together
1. Data Analytics Finds the Insights
- Data analytics involves examining and processing raw data to uncover patterns, trends, and useful information.
- Example: Analytics can reveal that sales are highest in the winter months.
2. Data Visualization Shows the Insights
- Data visualization turns those analytical findings into visual formats like graphs, charts, or maps.
- Example: A bar chart can display winter months’ sales compared to other seasons.
3. Together They Tell a Complete Story
- Analytics gives meaning to the data, while visualization makes it easy to understand and communicate.
- This combination helps decision-makers see the “what” and “why” behind the data.
Difference between Data Analytics and Visualization
| Aspects | Data analytics | Data Visualization |
|---|---|---|
| Definition | Examining and interpreting data to extract insights. | Representing data visually for better understanding. |
| Objective | Solve problems and support decision-making. | Communicate insights clearly to stakeholders. |
| Skill Set Required | Analytical, statistical, and programming skills. | Design, storytelling, and visualization tools expertise. |
| Tools Used | Python, R, SQL, Excel, SAS. | Tableau, Power BI, Matplotlib, Excel. |
| Outcome | Insights, predictions, or models. | Charts, graphs, or dashboards. |
Conclusion
- Both Data Analytics and Data Visualization play essential roles in extracting and communicating the value of data.
- Data analytics focuses on uncovering insights through analysis, while data visualization ensures these insights are presented in a way that’s easy to comprehend.
- Together, they help businesses make informed decisions and achieve their goals efficiently.
- By understanding their unique purposes and workflows, you can better utilize the power of data in any domain.
And Want To Learn More
Explore our courses and start learning today!
Choose our Data Analytics Course to boost your skills and achieve your goals.

