
Python For Data Analytics
Data Analytics with Python: A Beginner’s Guide
- Data analytics is transforming industries by enabling informed decision-making based on data-driven insights. Among the many tools available, Python has become a favorite for data analytics due to its simplicity, flexibility, and extensive library ecosystem.
- This article explores how Python is used in data analytics, its benefits, and the key tools and techniques involved.
What is Data Analytics with Python?
Data Analytics with Python involves using Python programming to analyze, process, and interpret data. Python provides libraries and frameworks that simplify data handling, making it accessible for beginners and efficient for professionals.

Why Choose Python for Data Analytics?
Python is a go-to choice for data analytics because:
- Versatility: Supports structured, semi-structured, and unstructured data.
- Open-source: Free to use with active community contributions.
- Scalability: Handles small datasets to big data efficiently.
- Integration: Works well with databases, web services, and big data tools.
Why Python Will Stay Relevant:
Its ability to evolve with new technologies.
Continuous community and enterprise support.
Growing demand for Python-trained professionals.
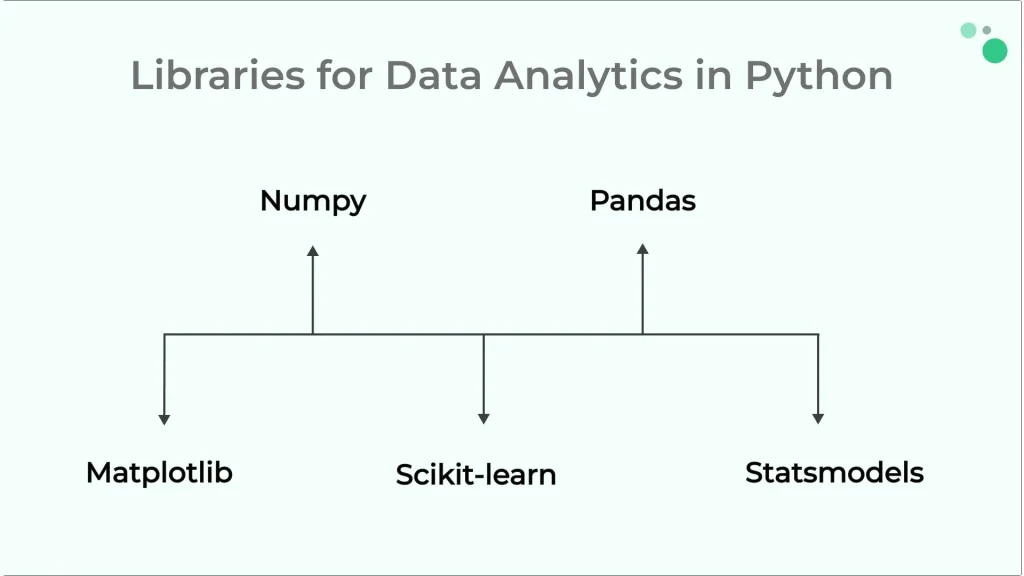
Key Libraries for Data Analytics Using Python
NumPy: Handles numerical computations and array operations.
Pandas: Simplifies data manipulation and analysis.
Matplotlib and Seaborn: Help in creating stunning data visualizations.
Scikit-learn: For machine learning and predictive analytics.
Statsmodels: Ideal for statistical modeling and hypothesis testing.
Data Analytics Process Using Python
The data analytics process typically involves:
- Data Collection: Gather data from sources like CSV files, databases, or APIs.
- Data Cleaning: Handle missing values, duplicates, and inconsistencies.
- Data Exploration: Understand data patterns using descriptive statistics and visualizations.
- Data Analysis: Apply statistical and machine learning techniques to derive insights.
- Data Visualization: Present insights using charts and graphs.
Applications of Data Analytics Using Python
Finance: Fraud detection, portfolio management.
Healthcare: Predictive modeling, patient data analysis.
Retail: Customer segmentation, inventory forecasting.
E-commerce: Recommendation systems, sales trend analysis.
How to Get Started with Data Analytics Using Python
- Learn Python Basics: Understand Python syntax and functions.
- Master Libraries: Focus on NumPy, Pandas, and Matplotlib.
- Work on Projects: Analyze datasets like customer data or sales trends.
- Take Online Courses: Platforms like Coursera, Udemy, or GeeksforGeeks offer excellent resources.
- Join Communities: Engage with forums like Kaggle and Stack Overflow.
Conclusion
Python’s versatility, ease of use, and rich ecosystem make it an ideal choice for data analytics. Whether you are a beginner or an experienced professional.
Python equips you with the tools needed to analyze and derive actionable insights from data. Start your journey today and unlock the potential of data analytics with Python!
Explore More Articles
And Want To Learn More
Explore our courses and start learning today!
Choose from a variety of topics to boost your skills and achieve your goals.

