
Various Data Sources for Tableau
Data sources for Tableau
Various Data Sources for Tableau in Data Analytics play a crucial role in enabling analysts to connect, analyze, and visualize data from multiple platforms. Tableau is a powerful data visualization tool that supports a wide range of data sources, from simple files like Excel and CSV to complex databases and cloud platforms.
Understanding these data sources is essential for building interactive dashboards, performing exploratory data analysis, and making data driven decisions. In real world data analytics, the ability to integrate multiple data sources in Tableau helps organizations gain deeper insights and improve business outcomes.

What is Tableau in Data Analytics?
Tableau is a leading data visualization and business intelligence tool that allows users to transform raw data into interactive dashboards and reports.
It is widely used because:
- It connects with multiple data sources
- Provides real time analytics
- Supports drag and drop visualization
Tableau simplifies complex datasets and helps in better decision making.
What are Data Sources in Tableau?
Data sources in Tableau refer to the origin of data that Tableau connects to for analysis and visualization.
These sources can include:
- Files
- Databases
- Cloud platforms
- APIs and web connectors
Tableau allows integration of multiple data sources, enabling analysts to combine and analyze data efficiently.
Types of Various Data Sources for Tableau
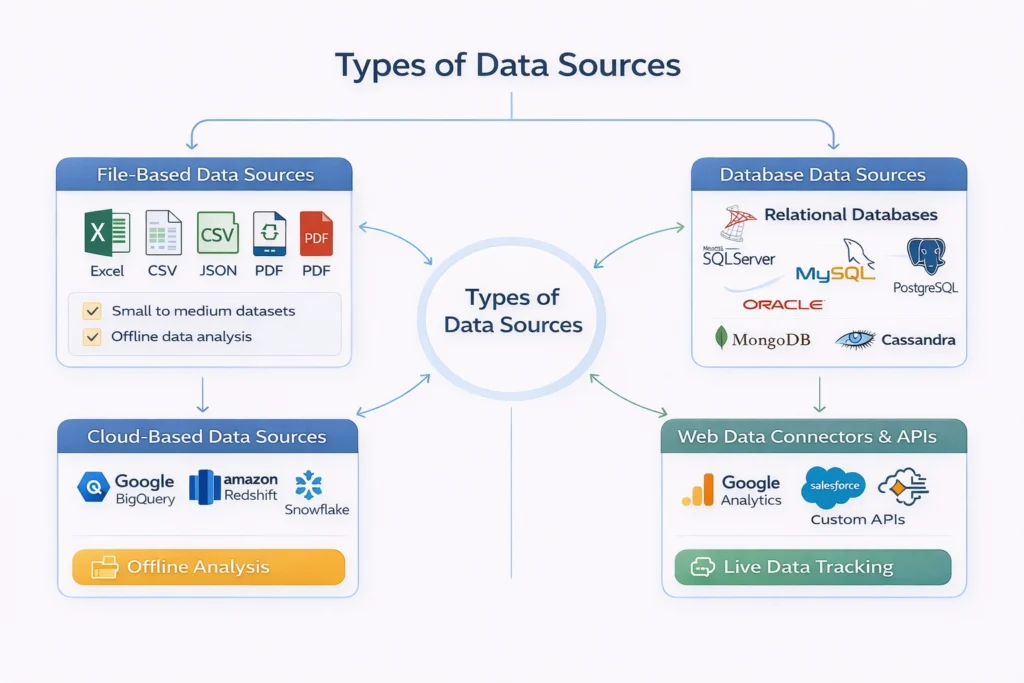
1. File Based Sources:
- Excel: Widely used for structured data with tables, pivot tables, and formulas.
- CSV: Flat files for large datasets with plain text, separated by commas.
- JSON: Used for hierarchical or semi-structured data.
- PDF: For extracting tables directly from reports or documents.
2. Databases:
- Relational Databases: Includes SQL Server, MySQL, PostgreSQL, Oracle, etc.
- Cloud Databases: Google BigQuery, Amazon Redshift, Snowflake, etc.
- NoSQL Databases: MongoDB, Cassandra, etc., for unstructured data.
3. Cloud Based Services and APIs:
- Google Analytics, Salesforce, AWS, and other platforms Tableau can integrate with.
4. Other Sources:
- Web data connectors for scraping or integrating live data from websites or custom APIs.
Important Skills for Tableau
- Data Connectivity: Knowledge of how to connect Tableau to file based, database, and cloud sources.
- Data Preparation: Experience in cleaning and transforming data using Tableau Prep or within Tableau.
- SQL Proficiency: Ability to write queries to extract and manipulate data directly from databases.
- Understanding of Data Models: Knowledge of relationships, joins, unions, and blending data sources in Tableau.
- Visualization and Analytics: Proficiency in creating dashboards, filters, and calculated fields for insightful analysis.


Uses of Tableau in Data Analytics
Tableau simplifies the process of turning raw data into actionable insights.
Its connectivity with various data sources ensures seamless integration and enables users to:
- Aggregate data from multiple sources.
- Perform exploratory data analysis.
- Create real time interactive dashboards.
- Identify trends, outliers, and patterns for informed decision-making.
Pros and Cons of Each Data Source....
1. Excel
Pros:
- Simple and widely used.
- Excellent for structured data with small to medium datasets.
- Easy to manipulate and prepare before connecting to Tableau.
Cons:
- Limited scalability with large datasets.
- No real-time updates unless refreshed manually.
2. CSV (comma separated values)
Pros:
- Lightweight and easy to share.
- Universal format compatible with most tools.
- Ideal for exporting large datasets from databases.
Cons:
- No support for formulas or pivot tables.
- Lacks structure for complex data.
3. Databases
Pros:
- Handles large scale datasets efficiently.
- Supports real time updates and advanced queries.
- Ideal for enterprise level applications and analytics.
Cons:
- Requires technical expertise (Ex. SQL).
- Connection setup can be complex for beginners.
Real time collaboration and updates.
Ideal for small teams and dynamic data.
2. JSON Files:
Great for hierarchical data from APIs.
3. Cloud Based Services:
Real time data from platforms like Salesforce, AWS, and Google Analytics.
4. Big Data Sources:
Tools like Hadoop and Spark for handling massive datasets.
Pros and Cons of Tableau’s Wide Data Connectivity
Pros:
- Flexibility: Connects to over 70 data sources, supporting both file based and database sources.
- Real Time Analysis: Supports live connections for dynamic data updates.
- Scalability: Handles datasets of all sizes, from small files to enterprise level databases.
- User Friendly: Intuitive drag and drop interface for non technical users.
Cons:
- Cost: Tableau licenses can be expensive.
- Learning Curve: Advanced features require training and expertise.
- Dependency on Data Quality: Poor data preparation can lead to inaccurate results.
How to Work with These Sources in Tableau?
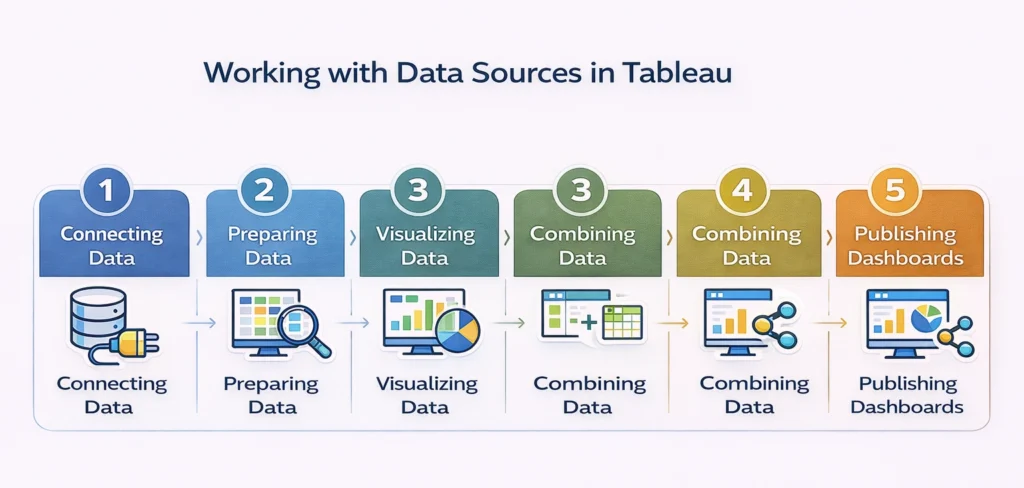
1. Connecting Data:
- Navigate to the Connect pane in Tableau.
- Select the appropriate data source (e.g., Excel, CSV, database).
- Establish a connection and import the data.
2. Preparing Data:
- Use Tableau Prep or built-in tools to clean and format data.
- Handle null values, duplicates, and inconsistencies.
3. Visualizing Data:
- Drag and drop fields onto Rows and Columns shelves.
- Apply filters, calculated fields, and parameters to refine visualizations.
4. Combining Data:
Use joins, unions, or blends to integrate data from multiple sources.
5. Publishing Dashboards:
Share visualizations using Tableau Online, Tableau Server, or Tableau Public.
Skills & Tools Used in Data Analytics:
Importance of Various Data Sources for Tableau
Understanding various data sources for Tableau in data analytics is important because:
- Enables integration of multiple datasets
- Supports real time and historical analysis
- Improves dashboard accuracy and helps in better decision making
- Enhances data visualization capabilities
Conclusion….
- Understanding Tableau’s various data sources is critical for effective data visualization and analysis.
- Excel, CSV, and databases each offer unique benefits for different use cases, while Tableau’s flexibility to connect to diverse sources ensures seamless integration for any data-driven task.
- By mastering these connections, you can unlock Tableau’s full potential to deliver powerful insights and make data-driven decisions.
If you want to learn more About Tableau and other skills to master Data Analytics then checkout Career247’s Data Analytics Course…..
Frequently Asked Questions
Answer:
Various data sources for Tableau include file based sources like Excel and CSV, databases like SQL Server and MySQL, cloud platforms like BigQuery, and web connectors like APIs.
Answer:
Common probability distributions include binomial, Poisson, normal, uniform, and exponential distributions, each used for different types of data analysis.
Answer:
Live connection provides real time data, while extract connection stores a snapshot for faster performance.
Answer:
It depends on the use case, Excel for small data, databases for large data, and cloud platforms for scalability.
Answer:
File based sources include Excel, CSV, JSON, and PDF files used for simple and structured data analysis.

