
Workflow of Data Analytics
Understanding the Basic Workflow of Data Analytics
This article will introduce you to the basics of workflow of data analytics, covering essential steps like data collection, cleaning, analysis, and visualization. Whether you’re a beginner or looking to enhance your skills, this guide will provide a clear understanding of the process and its importance.

What is Data Analytics?
- Data analytics refers to the process of examining, cleaning, transforming, and modeling data with the goal of discovering useful information, drawing conclusions, and supporting decision-making.
- It involves techniques and methods from statistics, machine learning, and artificial intelligence (AI) to analyze complex data sets.
- Data analytics is used across various industries to help organizations make data-driven decisions.
What Does Data Analytics Include?
Work Process:
- Data Collection: Gathering relevant and accurate data from different sources.
- Data Cleaning: Removing or correcting erroneous, incomplete, or irrelevant data.
- Data Transformation: Converting data into a usable format for analysis.
- Data Analysis: Applying statistical or machine learning models to extract insights.
- Data Visualization: Presenting the data in graphical formats (charts, graphs, dashboards).
- Reporting & Decision Making: Communicating findings and using data to inform business decisions.
Technicalities:
- Data Types: Qualitative (text, categorical data), Quantitative (numeric data), Time-series, etc.
- Statistical Techniques: Regression analysis, hypothesis testing, correlation, etc.
- Machine Learning Models: Supervised and unsupervised learning, clustering, classification, etc.
- Data Architecture: Knowledge of databases, cloud storage, data lakes, and warehouses.
Data Analytics Workflow
A well defined data analytics workflow helps organizations collect, process, and analyze data efficiently to make better business decisions. By following a structured data analytics workflow, companies can transform raw data into meaningful insights that drive growth and performance.
An effective data analytics workflow usually includes data collection, data cleaning, data analysis, and data visualization. When businesses properly implement a data analytics workflow, they can identify trends, improve strategies, and gain a competitive advantage in their industry.
Skills & Tools Used in Data Analytics:
Workflow of Data Analytics Practices
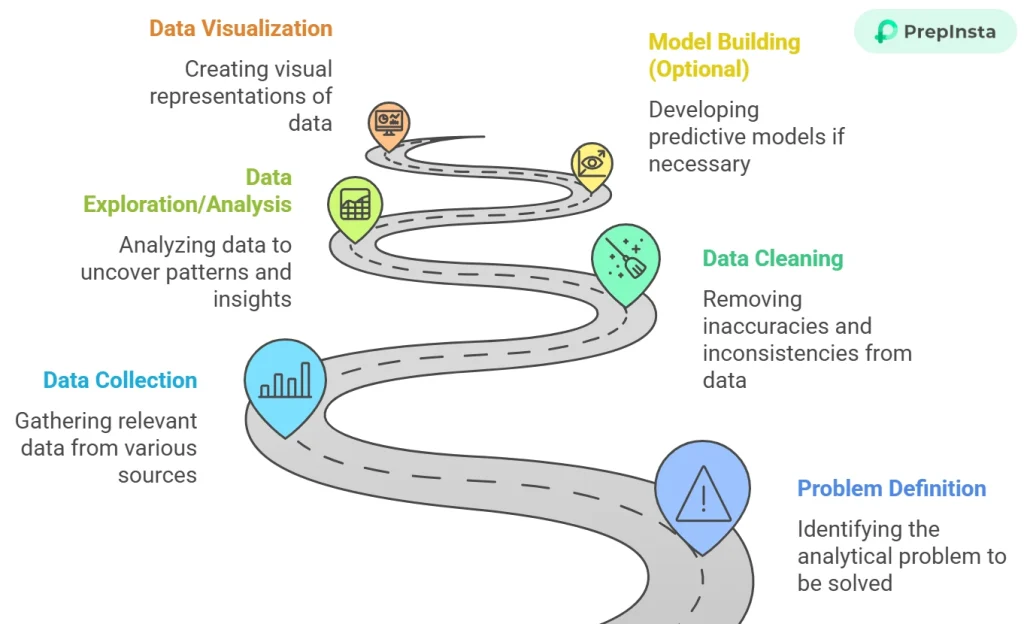
Data Analytics mainly includes following steps in the workflow:
- Problem Definition
- Data Collection
- Data Cleaning
- Data Exploration/Analysis
- Model Building
- Data Visualization
- Insights and Reporting
- Decision Making
1. Problem Definition:
- Description: Understand the business problem or question you’re trying to answer. This step defines the scope of analysis and what you need to achieve.
- Real-World Example: A retail company wants to understand the reasons for declining sales in a specific region.

2. Data Collection:
- Description: Gather the relevant data from different sources, such as internal databases, APIs, web scraping, or third-party services.
- Real-World Example: Collecting sales data, customer demographics, and competitor performance data.
3. Data Cleaning:
- Description: Process the data to correct or remove errors, such as missing values, duplicates, or inconsistencies.
- Real-World Example: Removing duplicate customer entries or filling in missing age values.
4. Data Exploration/Analysis:
- Description: Analyze the data using statistical methods or visualizations to understand trends, patterns, and outliers.
- Real-World Example: Analyzing sales trends over time to identify whether there is a seasonal pattern or irregular fluctuations.
5. Model Building (Optional):
- Description: If predictive insights are needed, build machine learning models (classification, regression) to forecast future trends or behaviors.
- Real-World Example: Building a predictive model to forecast future sales based on historical data.
6. Data Visualization:
- Description: Present the findings in an easily interpretable format using charts, graphs, or dashboards.
- Real-World Example: Creating a dashboard with graphs showing sales performance across regions.
7. Insights and Reporting:
- Description: Extract actionable insights from the data and report findings to stakeholders in a clear and concise manner.
- Real-World Example: Reporting to the management that sales in a specific region are declining due to customer dissatisfaction with a recent product update.
8. Decision Making:
- Description: Use the insights gathered to support decision-making. This could involve improving strategies, changing policies, or optimizing operations.
- Real-World Example: Suggesting product improvements or pricing strategies to boost sales in the declining region.

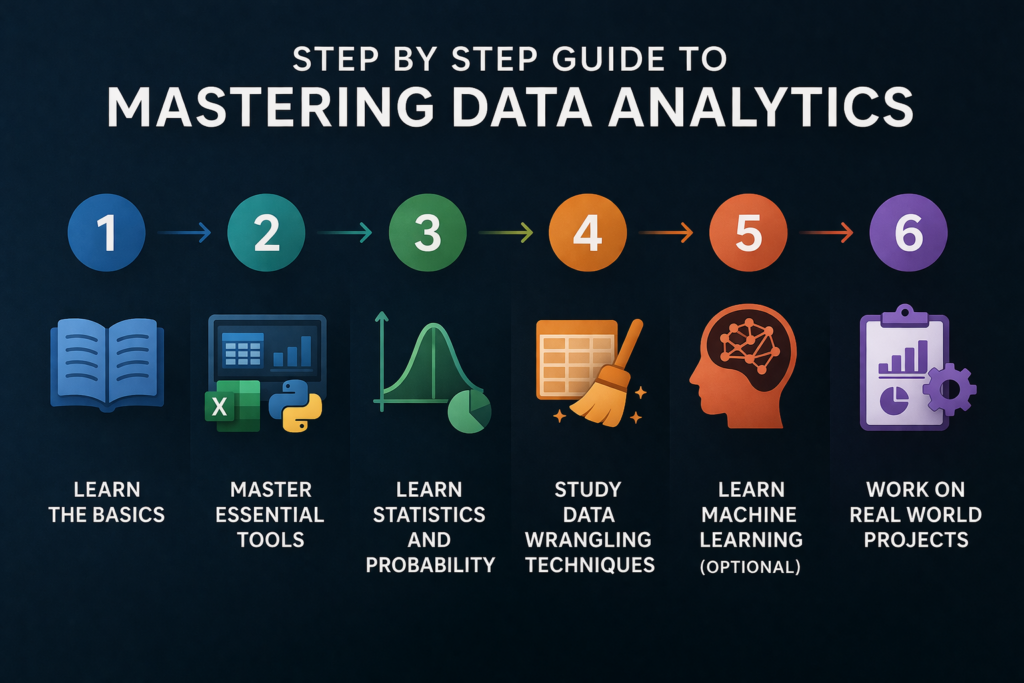
Step by Step Guide to Mastering Data Analytics
1. Learn the Basics:
- Understand the core concepts: Statistics, probability, and business problem-solving.
- Get familiar with data types and data structure: Learn about different types of data (structured vs unstructured) and how to organize them for analysis.
- Understand the role of a Data Analyst: Know the different stages in a data analytics project and how to execute them.
2. Master Essential Tools:
- Excel: Learn how to manipulate and analyze data in Excel.
- SQL: Master querying databases to extract relevant data.
- Python/R: Learn these programming languages for data analysis, data cleaning, and visualization.
- Visualization Tools: Get comfortable with tools like Tableau or Power BI to present your findings.
3. Learn Statistics and Probability:
Focus on understanding descriptive statistics, inferential statistics, and probability theory, which are crucial for drawing conclusions from data.
4. Study Data Wrangling Techniques:
Learn how to clean and prepare raw data, handle missing values, outliers, and inconsistencies.
5. Learn Machine Learning (Optional):
If you’re interested in predictive analytics, start learning about supervised and unsupervised learning, algorithms like regression, classification, clustering, etc.
6. Work on Real World Projects:
Apply what you’ve learned by working on projects, preferably related to business problems. This will help you gain hands on experience and understand practical challenges.
Skills & Tools Used in Data Analytics:
Conclusion
Data analytics is a powerful tool for uncovering insights and enabling informed decision-making. By following a structured workflow, using the right tools, and applying essential techniques, businesses can solve real-world problems and gain a strong competitive advantage. Mastering data analytics also creates opportunities for innovation and long-term growth across different industries.
If you want to learn more about data analytics and build practical skills, you can check out the Career247 Course, which provides structured learning and industry-relevant training.
How to Become a Data Analyst After Learning the Data Analytics Workflow
Understanding the workflow of data analytics is the first step toward building a successful career in this field. Once you learn how data is collected, cleaned, analyzed, and interpreted, the next step is to enroll in a structured data analytics course to gain practical experience with real-world datasets.
If you are wondering how to become a data analyst, you should focus on learning tools like Excel, SQL, Python, and data visualization platforms like Power BI or Tableau. Many learners today prefer a data analyst course online because it allows them to learn at their own pace while working on industry projects.
Additionally, earning a data analyst certification can help validate your skills and improve your job opportunities. Employers often prefer candidates who have completed certifications from the best data analytics courses because they demonstrate practical knowledge of the complete analytics workflow.
Choosing the right learning path and continuously practicing projects is the key to becoming a successful data analyst in today’s data-driven industry.
Frequently Asked Questions
Answer:
The Six Steps of Data Analysis Process are simple stages used in every Data Analytics project. These include collecting data, cleaning it, transforming it, analyzing it, creating visuals, and finally making decisions. Together, they form the complete Workflow of Data Analysis.
Answer:
The Workflow of Data Analysis is the step by step process used to turn raw data into useful insights. In Data Analytics, this workflow starts with understanding the problem and ends with making decisions based on data.
Answer:
A data analytics workflow is a step-by-step process used to collect, process, analyze, and visualize data to generate useful insights for better decision-making.
Answer:
A typical Data Analytics project includes steps like defining the problem, collecting data, cleaning it, analyzing it, and presenting the results. These steps are part of the overall Workflow of Data Analysis.
Answer:
Data cleaning is an important step in the Workflow of Data Analysis. It helps remove errors, missing values, and duplicate data so that your analysis becomes more accurate and reliable in any Data Analytics project.
Answer:
To work on the Data Analysis process, you need basic knowledge of tools like Python, SQL, or Excel, along with analytical thinking. These skills help you handle each step of the workflow of Data Analytics smoothly.
Answer:
After learning the workflow, you should join a data analytics course to develop practical skills in tools like SQL, Python, and data visualization. This helps you apply theoretical knowledge in real projects.
Answer:
The best data analytics courses are those that include practical projects, case studies, and industry tools. Beginners should choose courses that cover the full analytics process from data collection to visualization.

