
How to solve Spider Web Chart Quickly

Directions to solve:
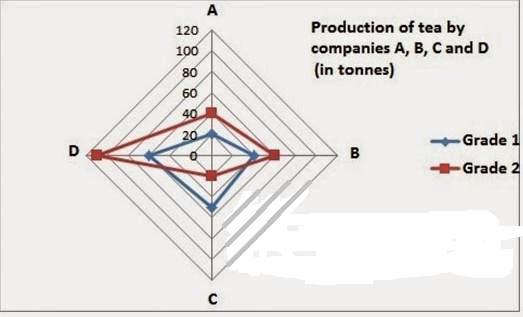
Question 1.
What is the difference between the average sales of grade 1 and 2 in all 4 companies?
a. 5 tonnes
b. 10 tonnes
c. 15 tonnes
d. 20 tonnes
e. 25 tonnes
Solution :
Average sales of grade 1= (20+40+50+60)/4= 42.5 tonnes
Average sales of grade 2= (40+60+20+110)/4= 57.5 tonnes
Difference= 57.5-42.5= 15 tonnes.
Question 2.
What is the difference between the total income of companies C and A?
a. Rs. 1.05 million
b. Rs. 10.05 million
c. Rs.1005 million
d. Rs. 1.05 crores
e. Rs. 10.05 crores
Solution :
Total income of companies A= (75000*20) + (60000*40) = Rs.3900000
Total income of companies C= (75000*50) + (60000*20) = Rs.4950000
Difference= Rs.1050000= Rs. 1.05 million.
Question 3.
What percentage of the net income of company A is constituted by grade 1 tea?
a. 50%
b. 33.33%
c. 25%
d. 40%
e. 38.46%
Solution:
Net income of company A= (75000*20)+(40*60000)= Rs.3900000
Grade 1 constitutes 38.46% ((150000/3900000)*100)

