
Role of Statistics in Data Analytics
Why Every Data Analyst Needs Statistics
Role of statistics in data analytics is extremely important because statistics helps analysts understand data, find patterns, measure uncertainty, and make reliable decisions. Data analytics is not just about creating dashboards or using tools like Excel, SQL, Python, Tableau, or Power BI. At its core, analytics is about asking the right questions and using data correctly to answer them.
Without statistics, data analysis can become guesswork. With statistics, analysts can summarize data, compare groups, detect outliers, test assumptions, and explain insights with confidence.

What is Statistics in Data Analytics?
Statistics in data analytics is the use of mathematical methods to collect, organize, analyze, interpret, and present data. It helps analysts understand what the data is saying and whether the insight is meaningful or just random variation.
For example, if a marketing campaign gets more conversions than another campaign, statistics helps answer:
- Is the difference actually meaningful?
- Could this result happen by chance?
- Is the sample size enough?
- Should the business trust this result?
This is why statistics is a foundation skill for every data analyst.
Why Statistics is Important in Data Analytics
Statistics gives structure to data analysis. It helps analysts move from simple observation to evidence based conclusion.
1. Helps Summarize Large Data
Businesses often deal with thousands or millions of records. Statistics helps summarize this data using values like:
- Mean
- Median
- Mode
- Standard deviation
- Percentiles
- Range
Instead of reading every row, analysts can quickly understand the overall pattern.
2. Helps Understand Data Distribution
Data distribution shows how values are spread in a dataset.
For example, customer spending may be normal, skewed, or affected by outliers.
Understanding distribution helps analysts identify:
- Typical values
- Extreme values
- Outliers
- Skewness
- Data spread
This is important before creating dashboards, reports, or machine learning models.
3. Helps Detect Outliers
Outliers are unusual values that are very different from the rest of the data.
Example: If most customers spend ₹500–₹2,000, but one customer has a purchase value of ₹2,00,000, it may be an outlier.
Statistics helps analysts decide whether the outlier is:
- real high value transaction
- data entry error
- fraud signal
- special case
This makes analysis more accurate.
4. Helps in Decision Making
Statistics helps businesses make decisions based on evidence.
For example:
- Which campaign performed better?
- Which product category is more profitable?
- Which customer group has higher retention?
- Which region has unstable sales performance?
Using statistical analysis in data analytics, businesses can reduce guesswork and improve decision quality.
5. Helps Measure Risk and Uncertainty
Business decisions always involve some uncertainty. Statistics helps measure that uncertainty.
For example: A company may predict future sales, but the prediction is never 100% fixed. Statistics helps estimate possible variation and risk.
This is useful in:
- Sales forecasting
- Budget planning
- Insurance analytics
- Financial analysis
- Demand prediction

Statistical Concepts Every Data Analyst Should Know
1. Mean, Median and Mode
These are measures of central tendency.
- Mean gives the average value.
- Median gives the middle value.
- Mode gives the most frequent value.
In business analytics, median is often more useful when data has outliers.
2. Standard Deviation
Standard deviation shows how much values vary from the average.
- low standard deviation means values are close to the average.
- high standard deviation means values are widely spread.
Example: If sales vary heavily month to month, standard deviation helps measure that instability.
3. Probability
Probability helps analysts understand the chance of something happening.
Example:
- Chance of customer churn
- Chance of fraud
- Chance of campaign conversion
- Chance of loan default
Probability is also important for predictive analytics and machine learning.
4. Correlation
Correlation shows the relationship between two variables.
Example:
- Discount and sales
- Marketing spend and revenue
- Website traffic and leads
Important note: correlation does not always mean causation. If two things move together, it does not always mean one caused the other.
5. Regression
Regression helps understand how one or more variables affect another variable. It is widely used in forecasting and predictive analytics.
Example:
A business may use regression to understand how advertising spend, discount, and product price affect sales.
6. Hypothesis Testing
Hypothesis testing helps analysts check whether a result is statistically meaningful.
Example:
A company runs two landing pages. Page A has a 5% conversion rate and Page B has a 6% conversion rate. Hypothesis testing helps check whether Page B is genuinely better or the difference happened by chance.
This is very useful in A/B testing and marketing analytics.
Role of Statistics in Exploratory Data Analysis
Exploratory Data Analysis, or EDA, is the process of understanding data before deeper analysis or modeling. Statistics plays a major role in EDA.
During EDA, analysts use statistics to:
- Check missing values
- Understand distributions
- Detect outliers
- Compare categories
- Find relationships
- Identify trends
- Validate assumptions
For example, before building a customer segmentation dashboard, an analyst may check average spending, median purchase value, purchase frequency, and customer distribution by region.
This makes the final analysis more reliable.
Role of Statistics in Business Analytics
In business analytics, statistics helps convert raw data into business insight.
For example:
| Business Question | Statistical Use |
|---|---|
| Which product sells most? | Descriptive statistics |
| Why did sales drop? | Trend and variance analysis |
| Which campaign is better? | Hypothesis testing |
| What will sales look like next month? | Regression and forecasting |
| Which customer is risky? | Probability and risk analysis |
This shows how statistics connects data with practical business decisions.
Statistics and GenAI in Data Analytics
With GenAI tools becoming common in analytics, statistics has become even more important. AI can generate summaries, SQL queries, Python code, and dashboard explanations. But analysts still need statistics to verify whether the output makes sense.
For example, GenAI may say “sales increased significantly,” but a data analyst should check:
- What is the actual percentage increase?
- Is the sample size enough?
- Is the trend consistent?
- Are there outliers?
- Is the conclusion statistically valid?
This is why statistics remains a core skill even in AI supported analytics workflows.
Learning Statistics for Data Analytics with GenAI
For learners who want a structured learning path, statistics should not be skipped. Career247’s Data Analytics with GenAI Course includes statistics as part of the learning journey, along with Excel, SQL, Python, Tableau, dashboards, projects, and GenAI supported analytics workflows.
This helps learners understand not only how to use tools, but also how to interpret data correctly, validate insights, and make better business decisions using analytics.
Common Mistakes Beginners Make in Statistics
Beginners often make these mistakes:
- Using average without checking outliers
- Confusing correlation with causation
- Ignoring sample size
- Trusting charts without checking data quality
- Not understanding variation
- Using AI generated insights without validation
- Skipping hypothesis testing in comparisons
Avoiding these mistakes helps analysts produce more accurate and trustworthy insights.
Practical Example: Statistics in Sales Analysis
Suppose a company wants to analyze monthly sales.
A data analyst may use:
- Mean to calculate average monthly sales
- Median to understand typical sales performance
- Standard deviation to measure sales fluctuation
- Correlation to check relationship between discount and sales
- Regression to forecast future sales
- Hypothesis testing to compare two campaigns
This shows how statistics supports the full analytics workflow.
So the conclusion is….
The role of statistics in data analytics is foundational. It helps analysts move beyond simple charts and understand what the data actually means.
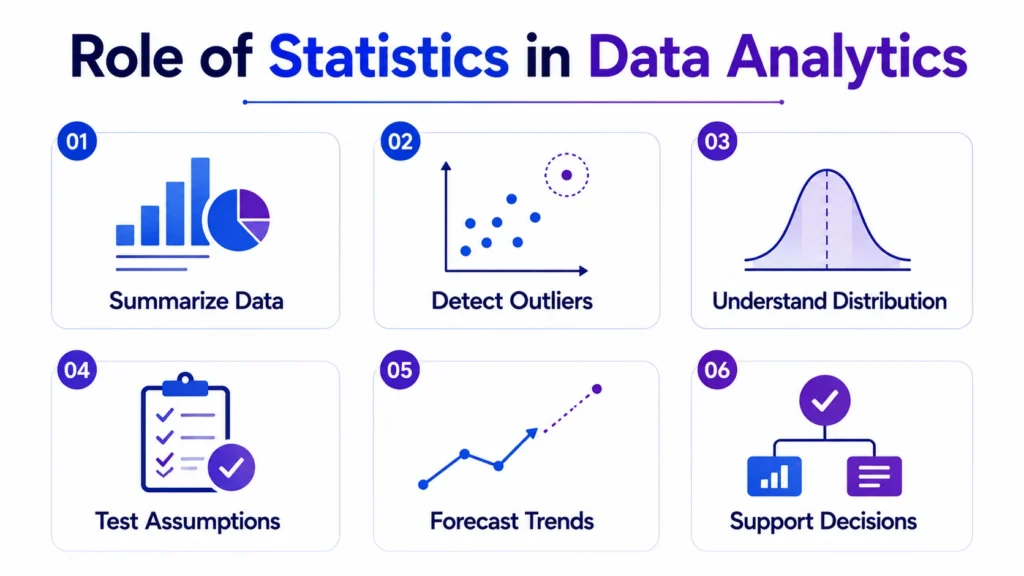
- From summarizing data and detecting outliers to testing hypotheses and forecasting trends, statistics supports every important stage of analytics.
- As GenAI becomes part of modern data workflows, statistical understanding becomes even more valuable.
- AI can support analysis, but analysts still need statistics to validate insights and make reliable business decisions.
For learners who want to build strong analytics skills, learning statistics along with Excel, SQL, Python, Tableau, dashboards, and GenAI workflows is a smart career step.

Frequently Asked Questions
Answer:
The role of statistics in data analytics is to help analysts summarize data, find patterns, measure uncertainty, test assumptions, detect outliers, and make reliable decisions.
Answer:
Statistics is important because it helps data analysts interpret data correctly and avoid wrong conclusions. It supports better reporting, forecasting, and decision making.
Answer:
A data analyst should know mean, median, mode, standard deviation, probability, correlation, regression, hypothesis testing, and data distribution.
Answer:
Yes, statistics is required for data analytics because it helps analysts understand data behavior, validate insights, and make data driven decisions.
Answer:
Statistics is used in EDA to understand distributions, detect outliers, compare groups, check missing values, and identify relationships between variables.

