
Regression Analysis in Machine Learning
About Regression Analysis in Machine Learning
Regression Analysis in Machine Learning – Regression is a foundational technique in machine learning, used to predict outcomes and uncover relationships between variables.
In this article, we’ll explore various types of regression, their applications across industries, and the mathematical principles behind them. Whether you’re a beginner or looking to deepen your understanding, this guide will help you master regression and apply it to real-world problems.
Dive in to learn how regression techniques are transforming data analysis and predictive modeling.

Introduction to Regression Analysis In Machine Learning
- Regression is a method used to analyze and model the relationship between a dependent variable and one or more independent variables.
- In simpler terms, it helps us predict the value of one variable based on the values of others.
- This technique is foundational in many fields of machine learning, especially when the goal is to forecast continuous outcomes, such as predicting the price of a house or the sales of a product.
- In machine learning, regression is primarily used for predictive modeling, where the model is trained on existing data and then used to predict future outcomes.
- Understanding regression is essential for anyone looking to build effective predictive models, especially in areas like finance, healthcare, and marketing.
How Regression Analysis In Machine Learning Works?
Regression techniques are among the simplest yet most powerful tools in machine learning. Their popularity stems from their ability to uncover relationships between variables, their interpretability, and their wide range of applications.
- Simplicity: Regression methods are generally easy to understand and implement. Unlike some other machine learning techniques, regression doesn’t require large amounts of data or computational power, making it accessible even for beginners.
- Interpretability: One of the key strengths of regression is that it provides clear insights into how independent variables influence the dependent variable. For example, a linear regression model may show how much the price of a house increases for every additional square foot of area.
- Versatility: Regression is used across a variety of industries. Whether you're predicting sales trends, stock prices, or health outcomes, regression provides a reliable framework for modeling these relationships.
Types of Regression Analysis – Regression Analysis in Machine Learning
Regression is not a one-size-fits-all approach.
There are several types, each suited to different types of data and relationships between variables.
Here are the most common ones used in machine learning:

Example:
Suppose you want to predict the salary of an employee based on years of experience. A linear regression model would fit a line that best represents the relationship between years of experience and salary.
Example:
Predicting a person’s weight using variables like age, height, and gender.
Example:
Modeling the relationship between a product’s price and the number of units sold, where the effect of price may not be linear.
Example:
If you have data with hundreds of features, lasso regression can help reduce the number of features used in the model by setting the less important coefficients to zero.
Example:
Predicting whether a customer will buy a product (yes or no) based on features such as age, income, and browsing history.
Example:
Ridge regression is useful when dealing with multi collinearity, where independent variables are highly correlated with each other.
In Depth Insights on Types of Regression Analysis In Machine Learning
1. Linear Regression
What is it?
- Linear regression is the simplest type of regression. It is used to predict a continuous (numeric) outcome based on one independent variable (input feature).
- Relationship between the dependent variable (the outcome) and the independent variable is assumed to be linear, meaning it can be represented as a straight line.
How does it work?
The linear regression equation looks like this:
Y = \beta_0 + \beta_1 X + \epsilon
where,
- Y: Dependent variable (output).
- X: Independent variable (input).
- \beta_0: Intercept.
- \beta_1: Coefficient for X
- ϵ : Error term
Example:
- Imagine you want to predict the price of a house based on its size. The larger the house, the higher the price.
- If the relationship between size and price is linear, you can use linear regression to predict the price based on the size.
2. Multiple Linear Regression
What is it?
Multiple linear regression is an extension of simple linear regression.
Instead of just one independent variable, it uses multiple independent variables (features) to predict the dependent variable.
How does it work?
The equation for multiple linear regression looks like this:
Y = \beta_0 + \beta_1 X_1 + \beta_2 X_2 + \dots + \beta_n X_n + \epsilon
where,
- \beta_0, \beta_1…….\beta_n are the coefficients.
- X_0,X_1……X_n are the independent variables.
Example:
- Let’s say you want to predict the price of a house based on not just its size, but also the number of bedrooms, the location, and the age of the house.
- Multiple linear regression allows you to combine all these factors into one model to make a more accurate prediction.
3. Polynomial Regression
What is it?
Polynomial regression is used when the relationship between the independent and dependent variables is not linear.
Instead of a straight line, the relationship is represented by a curve.
How does it work?
In polynomial regression, we add higher powers of the independent variable(s) to the model. The equation looks like this:
Y = \beta_0 + \beta_1 X + \beta_2 X^2 + \dots + \beta_n X^n + \epsilon
where,
- X^0,X^1…..X^n = Polynomial terms of the independent variable.
Example:
Suppose you’re trying to predict the sales of a product over time. At the beginning, sales might grow slowly, then pick up, and eventually level off.
Straight line won’t fit this curve well, so polynomial regression would be used to model the curve of sales over time.
4. Lasso Regression
What is it?
Lasso regression is similar to ridge regression but with a key difference: it can shrink some coefficients all the way to zero.
This is useful for feature selection because it automatically removes less important features from the model, keeping only the most relevant ones.
How does it work?
Lasso regression modifies the linear regression equation by adding a different penalty:
\text{Minimize: } \quad \sum_{i=1}^{n} (Y_i – \hat{Y}_i)^2 + \lambda \sum_{j=1}^{p} |\beta_j|
where,
- λ is the regularization parameter.
- Sum of the absolute values of the coefficients is used instead of the squared values.
Example:
If you are working with a large dataset and have many features, lasso regression helps automatically select the most important features by reducing the coefficients of the less useful ones to zero, improving the model’s interpretability and performance.
5. Logistic Regression
What is it?
Despite its name, logistic regression is actually used for classification tasks, not regression. It is used when the dependent variable is categorical, typically binary (e.g., yes/no, true/false, 0/1).
Logistic regression predicts the probability of one of the two classes, and it outputs a value between 0 and 1.
How does it work?
The logistic regression equation is:
P(Y = 1) = \frac{1}{1 + e^{-(\beta_0 + \beta_1 X_1 + \dots + \beta_n X_n)}}
where,
- P(Y=1): Probability that Y belongs to class 1.
Example:
You might use logistic regression to predict whether a customer will buy a product (yes or no) based on their age, income, and previous purchase behavior.
The model will give you the probability that a customer will buy the product.
6. Ridge Regression
What is it?
Ridge regression is a variation of linear regression that helps to deal with multicollinearity (when two or more independent variables are highly correlated) by adding a penalty to the regression model.
This penalty discourages the model from assigning too much importance to any one feature.
How does it work?
The equation for ridge regression (linear regression with L2 regularization):
\text{Minimize: } \quad \sum_{i=1}^{n} (Y_i – \hat{Y}_i)^2 + \lambda \sum_{j=1}^{p} \beta_j^2<br />
where,
- λ: Regularization parameter.
- \hat{Y}_i)^2
Example:
Suppose you’re trying to predict the sales of a product over time. At the beginning, sales might grow slowly, then pick up, and eventually level off.
Straight line won’t fit this curve well, so polynomial regression would be used to model the curve of sales over time.

Applications of Regression Analysis
Regression techniques are applied in many real-world scenarios across various industries. Here are some common applications:
1. Finance
- Stock Market Prediction: Regression models are used to predict the future price of stocks based on historical data, company performance, and economic factors.
- Risk Assessment: In lending and insurance, regression helps estimate the likelihood of a loan default or insurance claim.
2. Healthcare
- Patient Outcome Prediction: Regression can be used to predict the likelihood of a patient developing a certain disease based on factors like age, family history, and lifestyle.
- Treatment Personalization: It helps tailor treatments to individual patients by understanding how various factors influence health outcomes.
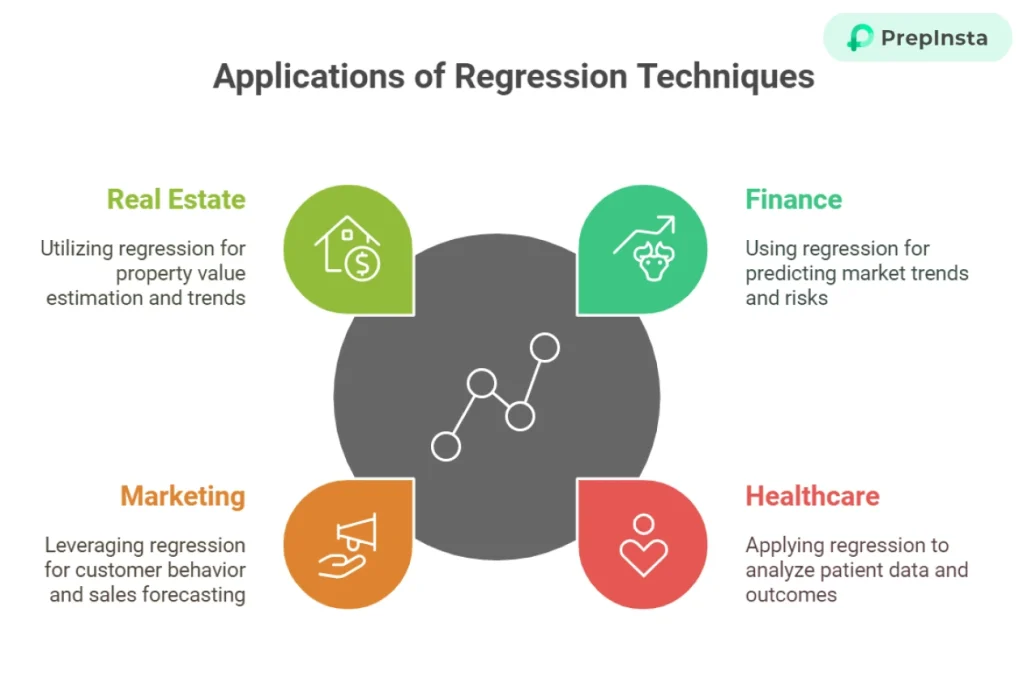
3. Marketing
- Customer Behavior Analysis: Regression helps analyze purchasing patterns and customer preferences. This data can be used to optimize marketing campaigns.
- Sales Forecasting: Companies use regression models to predict future sales based on historical data and market conditions.
4. Real Estate
- Property Valuation: Regression models help estimate property values based on features such as location, size, and the number of bedrooms.
- Rent Price Prediction: It can predict rental prices in different neighborhoods or cities based on factors like amenities, proximity to transportation, and market trends.
Mathematics Behind Regression
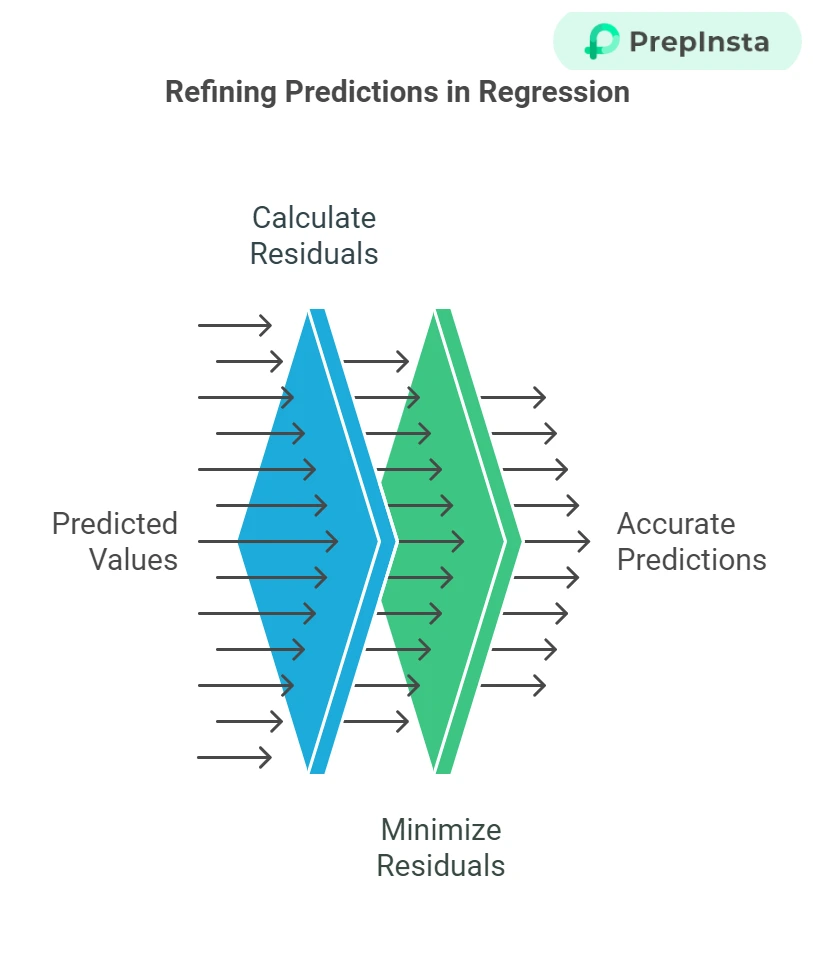
- Goal of regression is to find the best-fitting model that minimizes the difference between the actual and predicted values, known as residuals.
- The process of minimizing the residuals helps the model make accurate predictions.
1. Ordinary Least Squares (OLS):
OLS is the most commonly used method for estimating the parameters of a regression model. It minimizes the sum of squared residuals:
\text{Minimize} \quad \sum_{i=1}^{n} (Y_i – \hat{Y}_i)^2
- Y_i is the actual value of the dependent variable.
- \hat{Y}_i is the predicted value of the dependent variable.
- Summation runs from i=1 to n, representing the sum of squared differences across all data points.
Assumptions of Linear Regression
- Linearity: There is a linear relationship between the independent and dependent variables.
- Independence: Observations should be independent of each other.
- Homoscedasticity: The variance of the residuals is constant across all values of the independent variables.
- Normality: The residuals are normally distributed.
These assumptions ensure that the regression model is valid and reliable.
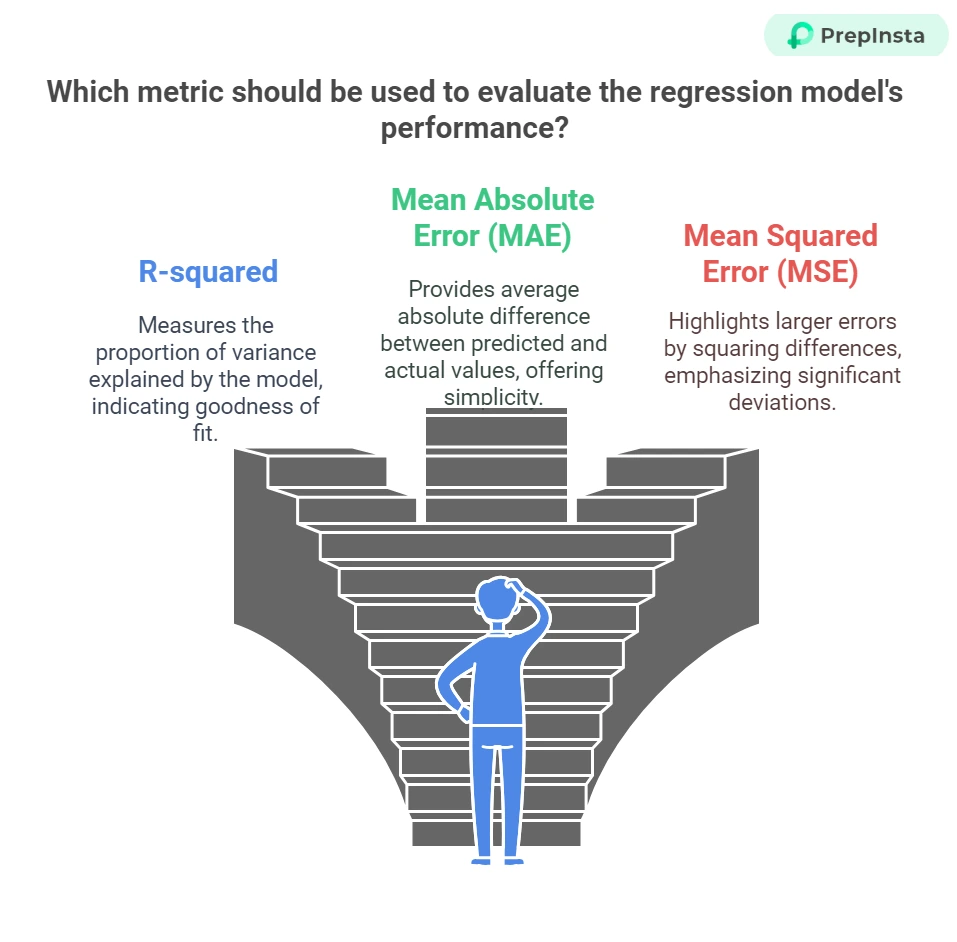
Evaluating Regression Models
After building a regression model, it’s crucial to assess its performance to ensure that it accurately predicts the dependent variable. Here are some common metrics used to evaluate regression models:
- R-squared:
Proportion of variance in the dependent variable that is explained by the independent variables. It ranges from 0 to 1, with a higher value indicating a better fit. - Mean Absolute Error (MAE):
The average of the absolute differences between the actual and predicted values. It provides a simple measure of model accuracy. - Mean Squared Error (MSE):
The average of the squared differences between actual and predicted values. Larger errors are penalized more due to squaring the differences. Root Mean Squared Error (RMSE):
Square root of MSE, which brings the error back to the same units as the dependent variable, making it easier to interpret.
Conclusion
- Regression analysis is a powerful technique in machine learning that is foundational for predictive modeling and statistical analysis.
- From linear regression to advanced methods like ridge and lasso regression, these techniques help us understand complex relationships in data and make informed decisions.
- Mastering regression allows data scientists and analysts to build robust models that can drive success across various fields, from finance to healthcare and beyond.
Frequently Asked Questions
Answer:
Regression Analysis in Machine Learning is a technique used to predict continuous values by identifying the relationship between input variables and output variables. It is commonly used for forecasting and trend prediction.
Answer:
The main types of regression analysis include Linear Regression, Multiple Regression, Polynomial Regression, Ridge Regression, Lasso Regression, and Logistic Regression. Each method is used depending on the complexity of the data.
Answer:
Regression analysis is used to predict future outcomes, understand data relationships, and support decision-making. It is widely used in finance, marketing, healthcare, and data analytics.
Answer:
Linear Regression is a basic regression algorithm that shows the relationship between variables using a straight line. It is mainly used for predicting numerical values like price or sales.
Answer:
Regression analysis assumes a linear relationship between variables, independent observations, normally distributed errors, and constant variance. These assumptions help improve model accuracy.
Answer:
Regression analysis is used in price prediction, sales forecasting, risk analysis, customer behavior prediction, and business growth analysis.

