
Life Cycle Phases of Data Analytics
Life Cycle Phases of Data Analytics
- Data analytics has revolutionized how organizations make decisions, enabling them to turn raw data into actionable insights. The process of data analytics follows a systematic lifecycle comprising multiple phases, each crucial for deriving meaningful conclusions.
- In this article, we’ll explore the life cycle phases of data analytics in detail and highlight their significance in transforming data into decisions.
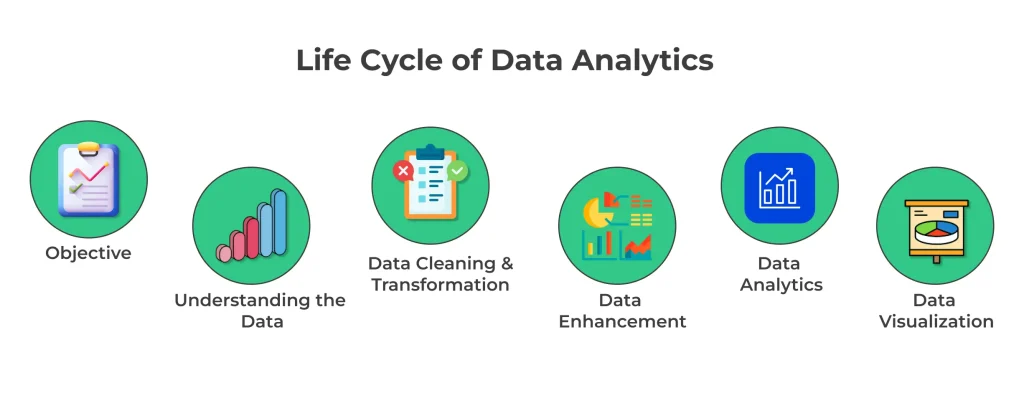
What is the Data Analytics Lifecycle?
The data analytics lifecycle is a structured process that ensures data-driven projects are executed effectively from start to finish.
Key Highlights:
- It involves steps from data collection to insight generation.
- Ensures that all critical aspects of data handling and analysis are covered.
- Helps streamline decision-making by providing a clear path to actionable insights.
Common Tools Used in Big Data Analytics
Phase 1: Data Discovery and Requirement Gathering
This initial phase focuses on understanding the problem and identifying the goals of the analysis.
Steps in Discovery Phase:
- Define the problem clearly.
- Understand the data requirements and business objectives.
- Identify data sources, such as databases, APIs, or spreadsheets.
Phase 2: Data Collection and Preparation
Data collection and preparation involve gathering relevant data and organizing it for analysis.
Steps in Data Collection:
- Gather data from multiple sources (structured or unstructured).
- Validate and clean the data to remove inconsistencies.
- Transform and format the data into a usable structure.
Pointers:
- Use tools like Python, SQL, or ETL frameworks.
- Handle missing values and outliers during the cleaning process.
- Ensure data is compliant with privacy standards like GDPR.
Methods of Data Analysis
There are several methods used in data analysis, depending on the goals and type of data:
- Descriptive Analysis: Summarizes past data to understand what has happened.
- Diagnostic Analysis: Explores the reasons behind past outcomes.
- Predictive Analysis: Uses historical data to forecast future trends.
- Prescriptive Analysis: Suggests actions to optimize outcomes.
Phase 4: Data Modeling and Analysis
This phase involves applying statistical methods and algorithms to uncover actionable insights.
Steps in Data Modeling:
- Choose the right model based on the problem (e.g., regression, clustering).
- Train and test the model using machine learning algorithms.
- Interpret results to align them with business goals.
Pointers:
- Use Python libraries like Scikit-learn or TensorFlow.
- Validate models using techniques like cross-validation.
- Continuously refine models for improved accuracy.
Phase 5: Interpretation and Communication of Results
After analyzing the data, the findings need to be communicated effectively to stakeholders.
Steps in Communication:
- Present insights using dashboards, charts, or reports.
- Connect findings with actionable recommendations for the business.
- Use storytelling techniques to make data relatable.
Pointers:
- Keep presentations concise and focused on key metrics.
- Tailor communication based on the audience (technical vs non-technical).
- Emphasize how insights solve the original problem.
Phase 6: Deployment and Monitoring
The final phase focuses on implementing the analytics solution and monitoring its performance.
Steps in Deployment:
- Integrate the analytics model into business workflows.
- Automate processes using dashboards or APIs.
- Monitor the solution to ensure it adapts to new data or conditions.
Pointers:
- Regularly review the model’s accuracy and performance.
- Use feedback to refine the solution.
- Stay updated with changing data trends.
Conclusion
The lifecycle phases of data analytics provide a systematic approach to solving data-driven problems effectively.
- Each phase plays a critical role in ensuring that the final insights are accurate, actionable, and aligned with business objectives.
- By mastering these phases, professionals can successfully implement data analytics solutions and drive impactful decisions in any organization.

