
Z Tests and T Tests
Z Tests and T Tests in Data Analytics
In today’s data-driven world, making decisions based on assumptions is no longer enough. Businesses, analysts, and researchers rely heavily on statistical methods to validate their insights. This is where Z tests and T tests play a crucial role in data analytics. These techniques help determine whether observed patterns in data are statistically significant or simply the result of random variation.
- Z Test is used when the sample size is large (n ≥ 30) and population variance is known.
- T Test is used when the sample size is small (n < 30) and population variance is unknown.
- Both are hypothesis testing techniques used to determine whether observed data differs significantly from expected values.
- Widely applied in data analytics, statistics, A/B testing, and machine learning validation.

What Are Z Tests and T Tests?
In data analytics, Z tests and T tests are powerful statistical methods used to evaluate hypotheses and support accurate, data driven decisions. These tests help analysts determine whether the difference between datasets such as averages, percentages, or performance metrics is statistically significant or simply due to random variation.
Understanding these tests is essential for anyone working with data, as they form the foundation of statistical analysis, experimentation, and predictive insights. Whether you’re analyzing user behavior, measuring campaign performance, or validating business strategies, Z and T tests provide the confidence needed to make informed decisions.
What Is a Z Test?
A Z test is a statistical test used when you have a large sample size (typically more than 30 observations) and the population variance is known. It assumes that the data follows a normal distribution, making it suitable for scenarios where data is stable and predictable.
Key Features of Z Test:
- Works best with large datasets
- Requires known population variance
- Based on normal distribution
- Produces highly consistent and reliable results
Common Use Cases:
- Comparing sample data with population data
- Testing conversion rates in digital marketing
- Quality control in manufacturing
- Financial and economic data analysis
Because larger datasets reduce uncertainty, Z tests are widely used in industries where high accuracy is required.
What Is a T Test?
A T test is used when working with small sample sizes (less than 30 observations) and when the population variance is unknown. It uses the t-distribution, which is more flexible and accounts for variability in smaller datasets.
Key Features of T Test:
- Ideal for small datasets
- Does not require known population variance
- More adaptable to real-world data
- Accounts for higher uncertainty
Common Use Cases:
- A/B testing in product development
- Comparing performance between two groups
- Medical and scientific research
- Small-scale experiments
Types of T Tests in Data Analytics
T tests are one of the most widely used statistical tools in data analytics for comparing means and understanding whether differences between datasets are statistically significant. They are especially useful when working with small sample sizes or when the population standard deviation is unknown. Depending on the nature of your data and research objective, different types of T tests are applied.
Let’s explore the three main types of T tests in detail:
One Sample T Test
A one sample T test is used to determine whether the mean of a single sample differs significantly from a known or hypothesized population mean.
This test is commonly applied when you want to validate assumptions or benchmark your sample data against a standard value.
Example:
A company claims that the average delivery time is 30 minutes. You collect sample data to verify whether the actual delivery time significantly differs from this claim.
When to Use:
- When comparing a sample mean to a fixed or known value
- When population standard deviation is unknown
- When working with a relatively small dataset
Why It Matters:
It helps businesses and analysts validate claims, check performance benchmarks, and make informed decisions based on sample data.
Independent T Test (Two-Sample T Test)
An independent T test compares the means of two different and unrelated groups to determine if there is a statistically significant difference between them.
This test assumes that the two groups are independent of each other and that the data is normally distributed.
Example:
Comparing the average sales performance of two different marketing strategies or two separate teams.
When to Use:
- When comparing two distinct groups
- When samples are independent (no overlap between groups)
- When evaluating the impact of different conditions or treatments
Why It Matters:
It enables data analysts to identify which group performs better and supports data-driven comparisons in experiments and A/B testing.
Paired T Test (Dependent T Test)
A paired T test is used when comparing two related observations, typically measured on the same subjects at different times or under different conditions.
This test focuses on the difference between paired values rather than comparing independent groups.
Example:
Measuring employee productivity before and after a training program.
When to Use:
- When working with related or matched data
- In before and after studies
- In repeated measurements on the same subjects
Why It Matters:
It helps measure the actual impact of changes, interventions, or treatments by eliminating variability between subjects.
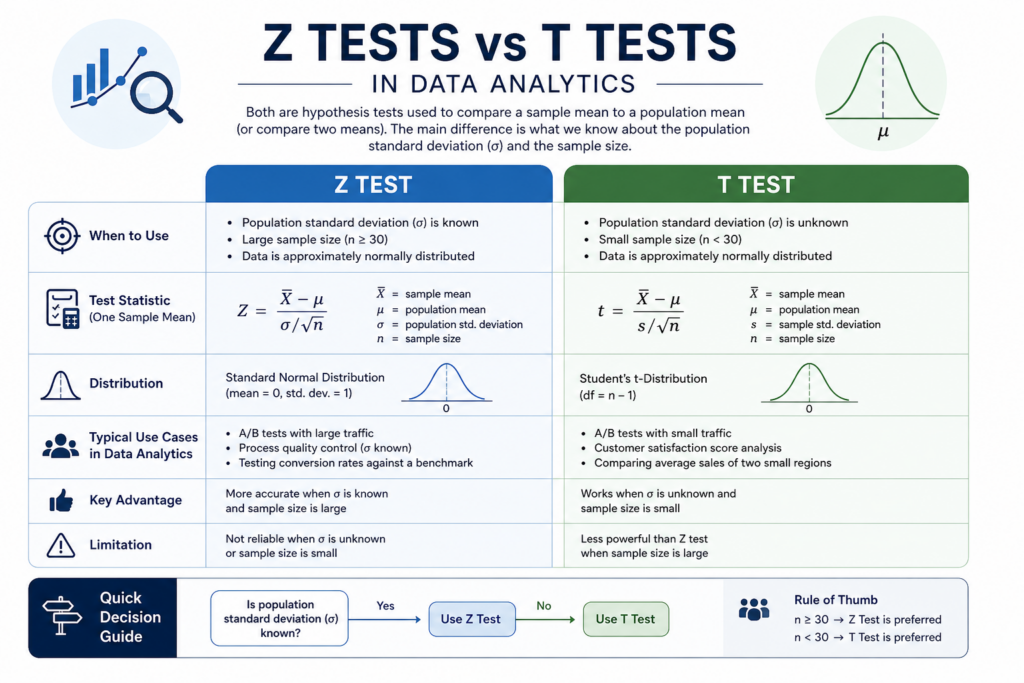
Key Differences Between Z Test and T Test
| Criteria | Z Test | T Test |
|---|---|---|
| Sample Size | Large (≥ 30) | Small (< 30) |
| Variance | Known | Unknown |
| Distribution | Normal Distribution | T Distribution |
| Accuracy | More accurate for large samples | Better for small samples |
| Use Case | Population-level analysis | Sample-based inference |
- A/B testing in product development
- Comparing performance between two groups
- Medical and scientific research
- Small-scale experiments


Importance of Z Tests and T Tests in Data Analytics
Z tests and T tests play a crucial role in modern data analytics by helping analysts move beyond guesswork and make decisions backed by statistical evidence. In a world driven by data, simply observing trends is not enough organizations need to verify whether those trends are statistically significant or just random variations. This is where Z tests and T tests become indispensable.
These hypothesis testing techniques allow analysts to compare datasets, validate assumptions, and measure the reliability of results. Whether you are working with large-scale datasets or smaller samples, these tests provide a structured approach to decision-making, ensuring that conclusions are accurate and trustworthy.
Why Z Tests and T Tests Matter
1. Improve Decision Accuracy
Z tests and T tests help businesses and analysts make precise decisions by validating whether observed differences are real. For example, companies can use these tests to determine if a new marketing campaign truly improved conversion rates or if the results occurred by chance.
2. Reduce Uncertainty in Analysis
Data often contains variability, and not every pattern is meaningful. These tests quantify uncertainty and provide confidence in results, allowing analysts to distinguish between noise and actual trends.
3. Support Hypothesis Testing
At the core of data analytics is hypothesis testing. Z tests and T tests allow analysts to test assumptions (null and alternative hypotheses) and determine whether to accept or reject them based on statistical evidence.
4. Enable Evidence-Based Strategies
Organizations rely on data-driven strategies to stay competitive. These statistical tests ensure that decisions—whether related to product development, pricing, or customer behavior—are backed by solid evidence rather than intuition.
5. Strengthen Business Intelligence
Accurate data interpretation is the foundation of business intelligence. By applying Z tests and T tests, analysts can generate reliable insights that support forecasting, performance evaluation, and strategic planning.
Real-World Applications
Z tests and T tests are widely used across industries:
- Marketing Analytics: Measure campaign effectiveness and A/B test results
- Finance: Evaluate investment strategies and risk factors
- Healthcare: Compare treatment outcomes and clinical trial results
- E-commerce: Analyze user behavior and conversion rate changes
- Product Development: Test feature performance before launch
Conclusion
Z Tests and T Tests form the backbone of statistical decision-making in data analytics, enabling professionals to draw conclusions that are not only insightful but also statistically reliable. In an era where data drives strategy, these tests help ensure that every decision is supported by measurable evidence rather than assumptions or intuition.
Z Tests are particularly effective when working with large datasets where population variance is known, offering speed and precision in evaluating hypotheses. On the other hand, T Tests provide the flexibility needed for smaller sample sizes or situations where variance is unknown, making them highly practical in real world analytical scenarios.
Frequently Asked Questions
Answer:
Z tests and T tests play a central role in hypothesis testing by helping analysts evaluate assumptions using sample data. They determine whether observed differences are statistically significant or due to random variation. This makes them essential tools for drawing reliable conclusions in data analytics.
Answer:
Both Z tests and T tests rely on specific assumptions for accurate results. These include normal distribution of data, independence of observations, and appropriate sample size. Z tests assume known population variance, while T tests are designed for situations where variance is unknown, making them more adaptable.
Answer:
Sample size is a critical factor when selecting between a Z test and a T test. Large sample sizes generally favor Z tests because they approximate normal distribution well. Smaller samples require T tests, as they account for increased variability and provide more accurate results in limited data scenarios.
Answer:
Statistical significance helps determine whether results are meaningful or just random noise. Z tests and T tests calculate p-values to assess this significance. A lower p-value indicates stronger evidence against the null hypothesis, allowing analysts to make confident, data-driven decisions.
Answer:
In business analytics, Z tests and T tests are widely used for comparing performance metrics, customer behavior, and marketing strategies. They help organizations evaluate experiments such as A/B testing, pricing strategies, and product improvements, leading to better decision-making.
Answer:
Misapplying Z tests and T tests can lead to incorrect conclusions. Common mistakes include ignoring assumptions, using the wrong test for sample size, and misinterpreting p-values. Ensuring proper test selection and data validation is crucial for achieving accurate and reliable analytical results.

