
Types of Data Fields in Tableau
Types of Data Fields in Tableau
Dimensions vs Measures Explained
Different types of data fields in Tableau play a crucial role in how data is analyzed and visualized. The two primary field types that are dimensions and measures in Tableau, form the foundation of every chart, graph, and dashboard. Understanding how these fields work helps users organize data correctly, build meaningful visualizations, and avoid common mistakes while working in Tableau.
What are Data Fields in Tableau?
In Tableau, data fields represent columns from your dataset. These fields are used to create visualizations by dragging and dropping them into the workspace.
Data fields are mainly categorized into:
- Dimensions (qualitative data)
- Measures (quantitative data)
These two types determine how data is displayed and analyzed.
What are Dimensions in Tableau?
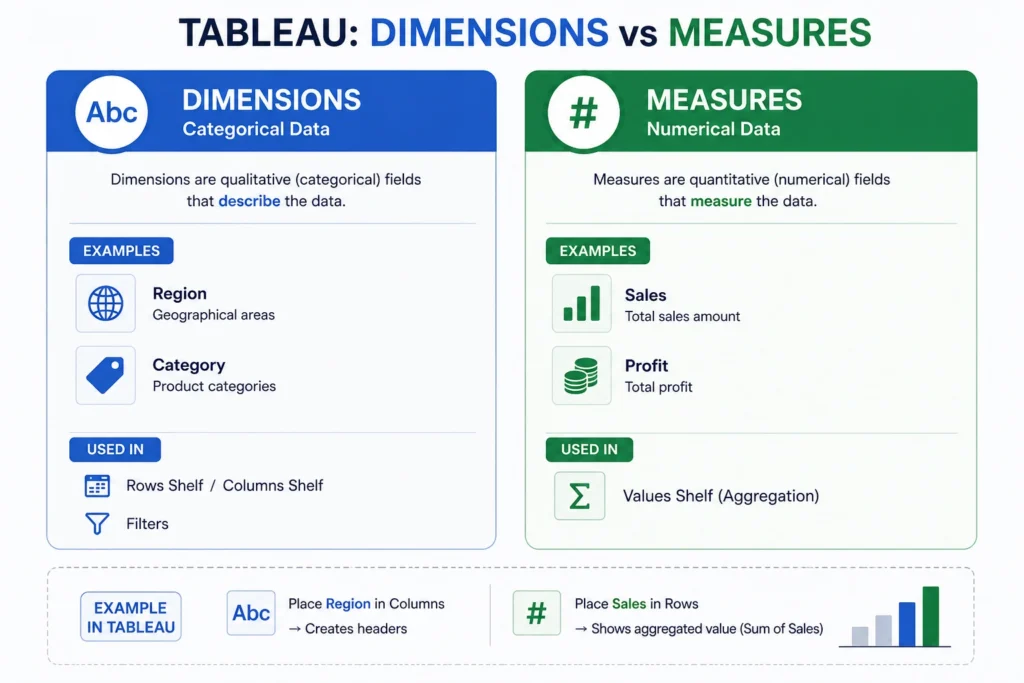
Dimensions are categorical fields used to describe and segment data.
Examples:
- Region
- Category
- Customer Name
- Product Type
Key Characteristics:
- Contain qualitative (non numerical) data
- Used for grouping and labeling
- Typically displayed as headers in visualizations
Dimensions answer: “What kind of data is this?”
What are Measures in Tableau?
Measures are numerical fields used to perform calculations and analysis.
Examples:
- Sales
- Profit
- Quantity
- Revenue
Key Characteristics:
- Contain quantitative (numerical) data
- Aggregated by default (SUM, AVG, etc.)
- Used to create charts and graphs
Measures answer: “How much or how many?”
Dimensions vs Measures in Tableau
Understanding the difference between dimensions vs measures in Tableau is essential for building correct visualizations.
| Feature | Dimensions | Measures |
|---|---|---|
| Type | Qualitative | Quantitative |
| Data | Text / Categories | Numbers |
| Usage | Grouping | Calculation |
| Example | Region | Sales |
| Aggregation | No | Yes |
How Tableau Identifies Dimensions and Measures
Tableau automatically categorizes fields based on data type:
- Text fields → Dimensions
- Numeric fields → Measures
- Date fields → Can act as both
However, users can manually change field types when needed.

Discrete vs Continuous Fields in Tableau
Another important concept related to data fields:
1. Discrete Fields:
- Represent distinct values
- Create headers in visualization
- Example: Category
2. Continuous Fields:
- Represent a range of values
- Create axes
- Example: Sales
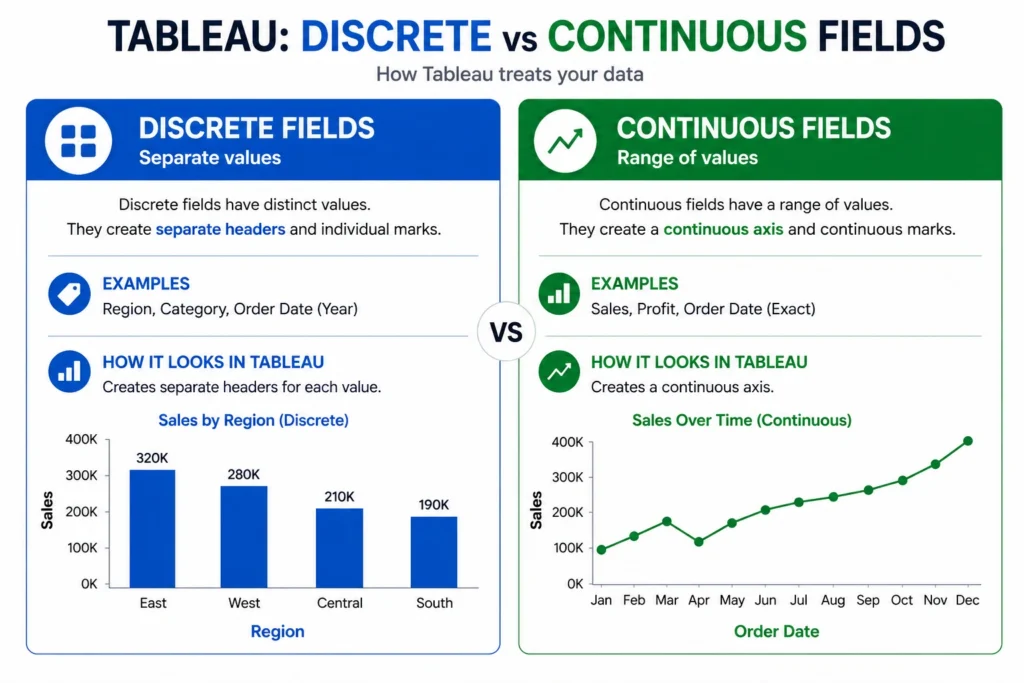
Green = Continuous
How Dimensions and Measures Work Together
Dimensions and measures are used together to create meaningful visualizations.
Example:
- Dimension → Region
- Measure → Sales
This combination helps in analyzing patterns and trends.
Practical Example in Tableau
If you drag:
- Region (Dimension) → Rows
- Sales (Measure) → Columns
You get:
A bar chart showing sales across regions. This is the most basic and powerful concept in Tableau.
Changing Data Field Types in Tableau
You can manually convert fields:
- Dimension → Measure
- Measure → Dimension
When to do this:
- Numeric IDs should be dimensions
- Calculated categories may need conversion
Common Mistakes to Avoid
- Treating numerical IDs as measures
- Misusing dimensions for calculations
- Ignoring aggregation in measures
- Confusing discrete and continuous fields
Real World Use Case of Dimensions and Measures
A company analyzes sales data:
- Dimensions: Region, Category
- Measures: Sales, Profit
Result: Dashboard showing sales trends by category and region.
So the final conclusion is….
Understanding the different types of data fields in Tableau, especially dimensions vs measures, is essential for building accurate and effective visualizations.
- These fields form the core of Tableau’s functionality and determine how data is grouped, analyzed, and displayed.
- By using dimensions for categorization and measures for calculations, you can create meaningful insights and dashboards that support data driven decision making.

Frequently Asked Questions
Answer:
The main types of data fields in Tableau are dimensions and measures, used for categorizing and analyzing data.
Answer:
Dimensions are categorical fields used for grouping, while measures are numerical fields used for calculations.
Answer:
Yes, fields like dates or numeric values can sometimes act as both depending on usage.
Answer:
Discrete fields represent distinct values, while continuous fields represent a range of values.
Answer:
Measures are aggregated to summarize numerical data for analysis.

