
Statistical Significance vs Practical Significance
Statistical Significance vs Practical Significance in Data Analytics
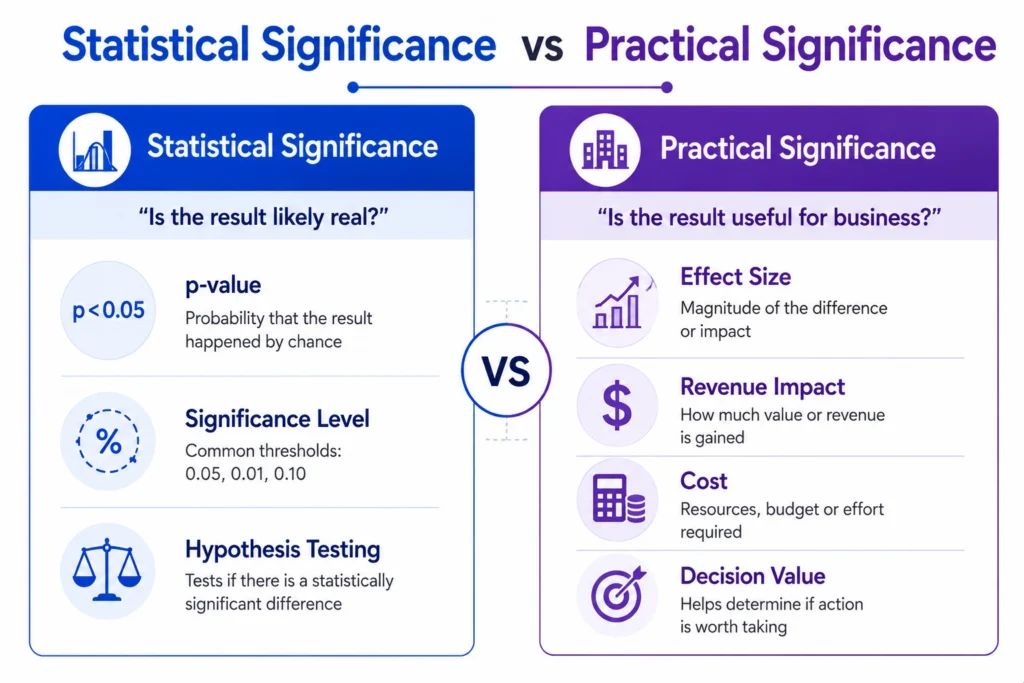
Statistical significance vs practical significance is an important concept in data analytics because not every statistically proven result is useful for business decisions.
In hypothesis testing, analysts often use p-values and significance levels to check whether a result is likely to be real or caused by random chance. But after that, they must also ask a practical question: Is this result meaningful enough to act on?

What is Statistical Significance?
Statistical significance tells us whether the result of an analysis is likely to be caused by a real effect rather than random chance.
In data analytics, it is commonly used in:
- Hypothesis testing
- A/B testing
- Campaign comparison
- Product experiments
- Survey analysis
Business performance testing
A result is usually considered statistically significant when the p-value is less than the chosen significance level, often 0.05.
Example:
Suppose a company tests two landing pages:
- Landing Page A conversion rate: 8%
- Landing Page B conversion rate: 9%
If the p-value is 0.03, and the significance level is 0.05, the result is statistically significant. This means there is enough evidence to say that the difference is unlikely to be random.
What is Practical Significance?
Practical significance tells us whether the result is large enough, useful enough, or valuable enough to matter in real life.
A result can be statistically significant but still not practically important.
Example:
A company runs an A/B test and finds that a new button color improves conversion rate by 0.05%.
Statistically, this may be significant if the sample size is huge. But practically, the business must ask:
- Will this improvement increase revenue meaningfully?
- Is it worth redesigning the page?
- Will the implementation cost be justified?
- Does the change affect user experience?
- Is the improvement important for business goals?
If the answer is no, then the result may not be practically significant.
Statistical Significance vs Practical Significance
| Factor | Statistical Significance | Practical Significance |
|---|---|---|
| Meaning | Shows whether the result is unlikely to be due to chance | Shows whether the result is useful or meaningful in real life |
| Based On | P-value, significance level, sample size | Business impact, cost, revenue, decision value |
| Main Question | Is the result statistically real? | Is the result worth acting on? |
| Used In | Hypothesis testing, A/B testing, experiments | Business decisions, strategy, implementation |
| Example | P-value is less than 0.05 | Conversion improvement increases revenue meaningfully |
In simple words, statistical significance checks whether the result is real, while practical significance checks whether the result matters.
Why This Difference Matters in Data Analytics
In data analytics, decisions should not be made only by looking at p-values. A p-value can tell whether a result is statistically meaningful, but it does not tell whether the result is valuable for the business.
For example, a company may test two ad campaigns. Campaign B performs slightly better than Campaign A and produces a statistically significant result.
But if Campaign B costs much more, requires extra resources, or improves performance only slightly, the business may still choose Campaign A.
This is why analysts must connect statistical results with business context.
Practical Example in Data Analytics
Suppose a company tests whether a new customer support process improves satisfaction scores.
- Old process average score: 4.10
- New process average score: 4.15
P-value: 0.02
Since the p-value is less than 0.05, the result is statistically significant.
But practically, the improvement is only 0.05 points. The company must ask:
- Is this improvement noticeable to customers?
- Does it reduce complaints?
- Does it improve retention?
- Is the new process more expensive?
- Does the improvement justify the operational change?
If the business impact is low, the result may not be practically significant.

Role in Hypothesis Testing
In hypothesis testing, statistical significance helps decide whether to reject the null hypothesis.
For example:
- Null hypothesis: There is no difference between Campaign A and Campaign B.
- Alternative hypothesis: Campaign B performs better than Campaign A.
If the p-value is below the significance level, the result is statistically significant.
But after that, analysts should check practical significance:
- How big is the improvement?
- Does it affect revenue?
- Is it useful for customers?
- Is it worth implementing?
This makes the conclusion more realistic and business friendly.
Role in A/B Testing
A/B testing is one of the best examples where both concepts are important.
Suppose an e-commerce company tests two checkout pages:
- Version A conversion rate: 12%
- Version B conversion rate: 12.3%
If the sample size is very large, this 0.3% improvement may become statistically significant. But the business must decide whether this 0.3% improvement is practically valuable.
If the website has millions of visitors, even a 0.3% improvement may generate strong revenue. But if the website has low traffic, the impact may be very small.
So, in A/B testing, practical significance depends on business scale, revenue impact, and implementation cost.
How to Check Practical Significance
To check practical significance, analysts should look beyond the p-value.
Important factors include:
- Effect Size: Effect size shows how large the difference or impact is.
- For example, a 20% improvement is usually more meaningful than a 0.2% improvement.
Business Impact: Check whether the result affects revenue, cost, customer satisfaction, retention, or operational efficiency.
Cost of Implementation: Even a positive result may not be useful if the cost of applying the change is too high.
Sample Size: Large samples can make very small differences statistically significant. Analysts should check whether the difference is actually meaningful.
Risk and Trade Off: Some changes may improve one metric but harm another.
Example: A discount may increase sales but reduce profit margin.
Conclusion….
Statistical significance vs practical significance is an important concept for every data analyst. Statistical significance tells whether a result is likely to be real, while practical significance tells whether the result is meaningful enough to act on.
- In business analytics, both are necessary. A result may pass a statistical test, but if it does not improve revenue, reduce cost, improve customer experience, or support a useful decision, it may not be practically important.
- For better analysis, data analysts should always combine statistical evidence with business context. This makes insights more accurate, useful, and decision ready.
Understanding concepts like statistical significance vs practical significance helps learners make better decisions from data, not just perform calculations.
Career247’s Data Analytics with GenAI Course includes statistics as part of the learning path, helping learners understand hypothesis testing, p-values, A/B testing, Excel, SQL, Python, Tableau, dashboards, and real-world analytics workflows.

Frequently Asked Questions
Answer:
Statistical significance means the result is unlikely to have happened by random chance. It is usually checked using p-value and significance level.
Answer:
Practical significance means the result is meaningful enough to matter in real world business decisions.
Answer:
Statistical significance checks whether a result is likely real, while practical significance checks whether the result is useful or valuable in practice.
Answer:
Yes, a result can be statistically significant but too small to create meaningful business impact.
Answer:
Practical significance helps businesses decide whether the improvement from an A/B test is large enough to justify implementation.

