
Statistical Inference
Unlocking Data Secrets Mastering Statistical Inference for Smarter Decisions
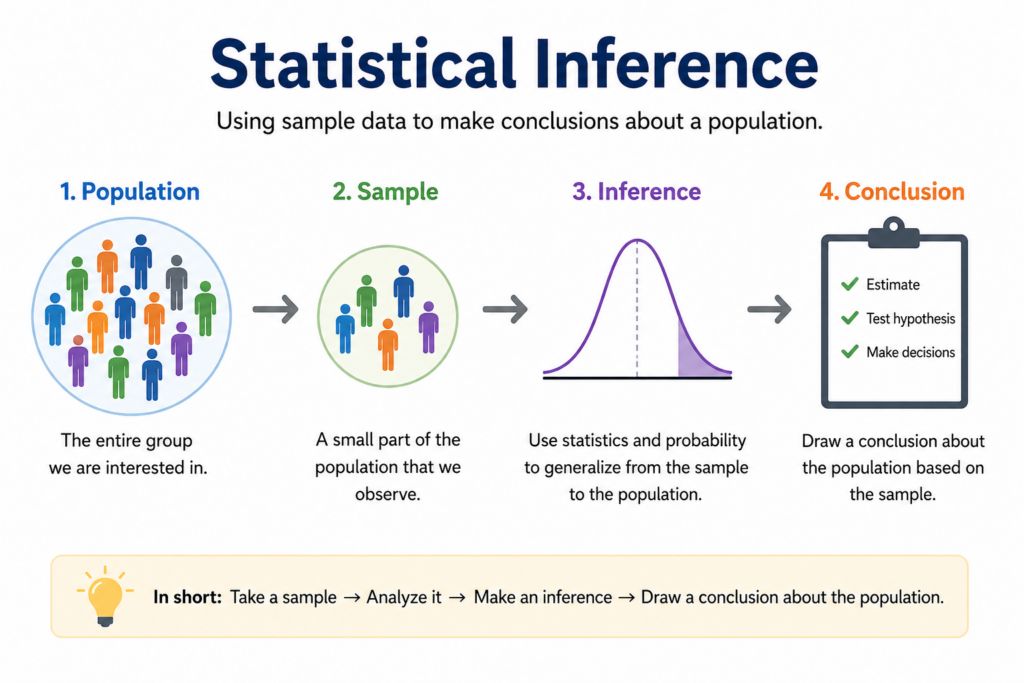
Statistical Inference is the process of using sample data to make accurate conclusions about a larger population. It combines probability, data analysis, and mathematical models to help individuals and organizations make informed decisions without analyzing every data point.
Example: Instead of surveying an entire city, statistical inference allows you to estimate average income using a smaller representative sample.
- Uses sample data to predict population behavior
- Core methods: Estimation and Hypothesis Testing
- Widely used in data science, business, healthcare, and AI
- Helps reduce cost, time, and uncertainty in decision-making

What is Statistical Inference?
Statistical inference is a method in statistics that allows us to draw conclusions about a population based on sample data. Since studying an entire population is often impractical, inference provides a reliable alternative using mathematical techniques.
In simple terms:
- Population: Entire group of interest
- Sample: Subset of the population
- Inference: Conclusion drawn from the sample
Why is Statistical Inference Important?
Statistical inference plays a key role in transforming raw data into meaningful and actionable insights. Instead of relying on guesswork, it allows organizations, researchers, and analysts to draw reliable conclusions from limited data. By using techniques like estimation and hypothesis testing, statistical inference helps uncover patterns, relationships, and trends that are not immediately obvious.
It is especially valuable in today’s data-driven world, where decisions must be quick yet accurate. Whether in business, healthcare, or technology, statistical inference provides a scientific basis for making informed choices and reducing uncertainty.
Key Benefits:
- Enables accurate predictions even with limited or sample data
- Supports data-driven decision-making and strategic planning
- Saves time and resources by avoiding the need to analyze entire populations
- Helps measure uncertainty and assess the reliability of results
- Forms the backbone of machine learning and AI models, improving their performance and accuracy
- Efficient and cost-effective
- Enables accurate predictions
- Provides measurable confidence
- Supports research and innovation

Types of Statistical Inference
Statistical inference mainly consists of two core approaches that help analysts draw conclusions from sample data. These methods allow us to either estimate unknown values or test assumptions about a population in a structured and scientific way.
1. Estimation
Estimation focuses on predicting unknown population parameters based on sample data. Instead of analyzing the entire population, we use a smaller dataset to make reliable approximations. This approach is widely used in surveys, forecasting, and data analysis.
Types:
- Point Estimation: Provides a single value as an estimate of the population parameter (e.g., average income).
- Interval Estimation: Provides a range of values, known as a confidence interval, within which the true parameter is likely to fall.
Example:
Estimating the average customer spending of an entire market using a sample survey. This helps businesses make pricing and marketing decisions without collecting data from every customer.
2. Hypothesis Testing
Hypothesis testing is used to evaluate claims or assumptions about a population using sample data. It helps determine whether observed results are statistically significant or occurred by chance. This method is essential in research, experiments, and decision-making processes.
Key Elements:
- Null Hypothesis (H₀): Assumes no effect, no difference, or status quo.
- Alternative Hypothesis (H₁): Suggests that there is an effect or a significant difference.
Example:
Testing whether a new marketing strategy leads to higher sales compared to the previous one. Based on the test results, companies can decide whether to adopt or reject the new strategy.
Key Concepts in Statistical Inference
To properly understand statistical inference, it’s important to be familiar with a few core concepts. These ideas form the foundation for analyzing data, drawing conclusions, and ensuring that results are both accurate and reliable.
• Population vs Sample
This is one of the most fundamental concepts in statistics. A population refers to the entire group you want to study, while a sample is a smaller subset selected from that population for analysis. Since studying the full population is often impractical, samples are used to make informed estimates about it.
• Sampling Distribution
A sampling distribution represents how a statistic (like the mean or proportion) varies across multiple samples taken from the same population. It helps in understanding the variability of estimates and plays a crucial role in making predictions and calculating probabilities.
• Confidence Interval
A confidence interval is a range of values that is likely to contain the true population parameter. Instead of giving a single estimate, it provides a margin of error along with a confidence level (commonly 95%), making the result more informative and reliable.
• Significance Level (α)
The significance level, denoted by alpha (α), is the probability of rejecting a true null hypothesis. It sets the threshold for decision-making in hypothesis testing, with 0.05 (5%) being the most commonly used value in practice.
• P-value
The p-value measures the strength of evidence against the null hypothesis. A smaller p-value indicates stronger evidence to reject the null hypothesis, while a larger value suggests that the observed result may be due to chance.
Steps in Statistical Inference
Statistical inference follows a clear and structured process that helps convert raw data into meaningful insights. By combining logical steps with statistical methods, it ensures that conclusions are accurate, reliable, and useful for decision-making.
Follow this approach:
- Define the Problem
Start by clearly identifying the objective or question you want to answer. A well-defined problem helps in selecting the right data and method for analysis. - Collect Sample Data
Gather relevant data from a sample that represents the population. The better the sample quality, the more trustworthy your results will be. - Choose a Method (Estimation or Testing)
Decide whether you want to estimate a population parameter or test a hypothesis. This choice depends on the goal of your analysis. - Analyze the Data
Apply statistical techniques to interpret the data. This step involves calculations, identifying patterns, and using models to extract insights. - Draw Conclusions
Based on the analysis, make informed decisions or inferences. Ensure that your conclusions are supported by data and clearly address the original problem.
- Depends heavily on sample quality
- Can produce errors if assumptions are wrong
- Sensitive to bias and outliers
- Requires proper statistical knowledge
Conclusion
Statistical inference is a powerful tool that helps transform data into actionable insights. By analyzing sample data, it allows us to make reliable predictions about larger populations. Whether you’re a data analyst, researcher, or business professional, understanding statistical inference is essential for making informed decisions in a data-driven world.

Frequently Asked Questions
Answer:
Statistical Inference is the process of using sample data to make conclusions about a larger population. It helps in predicting trends, testing hypotheses, and making data-driven decisions. This method is widely used in research, business analytics, and machine learning. It reduces uncertainty by applying probability theory.
Answer:
Statistical Inference is important because it allows analysts to draw meaningful insights without examining an entire population. It saves time and resources while still providing reliable results. Businesses and researchers use it to make informed decisions, identify patterns, and validate assumptions based on sample data.
Answer:
The two main types of Statistical Inference are estimation and hypothesis testing. Estimation involves predicting population parameters, such as mean or proportion, using sample data. Hypothesis testing is used to evaluate assumptions or claims about a population using statistical evidence.
Answer:
A confidence interval is a range of values that likely contains the true population parameter. It is expressed with a confidence level, such as 95%, which indicates reliability. Confidence intervals help measure uncertainty and provide a more informative result than a single estimate.
Answer:
Hypothesis testing is a method used to determine whether a claim about a population is true or not. It involves setting up a null hypothesis and an alternative hypothesis. Based on sample data and statistical calculations, a decision is made to accept or reject the null hypothesis.
Answer:
A population includes all individuals or data points of interest, while a sample is a smaller subset taken from it. Statistical Inference uses samples to estimate characteristics of the entire population. Proper sampling ensures accurate and unbiased results.

