
Regression Analysis in Machine Learning
Regression Analysis in Machine Learning
Regression Analysis in Machine Learning is one of the most fundamental and widely used techniques for predicting continuous outcomes. It helps in understanding relationships between variables and forecasting future values based on historical data. Whether it’s predicting house prices, sales revenue, or stock trends, regression plays a crucial role in data analytics and machine learning.
If you’re exploring predictive modeling, understanding regression is essential because it forms the foundation of many advanced machine learning algorithms.

What is Regression in Machine Learning?
Regression in machine learning is a supervised learning technique used to predict continuous numerical values based on input features.
- Input → Independent variables (features)
- Output → Dependent variable (target)
For example:
- Predicting salary based on experience
- Predicting house price based on location and size
Regression models estimate how one variable affects another and help in forecasting future outcomes.
What is Regression Analysis?
Regression analysis is a statistical method used to study the relationship between:
- Independent variables (X) → Inputs
- Dependent variable (Y) → Output
It helps:
- Identify patterns
- Understand relationships
- Make predictions
Types of Regression in Machine Learning
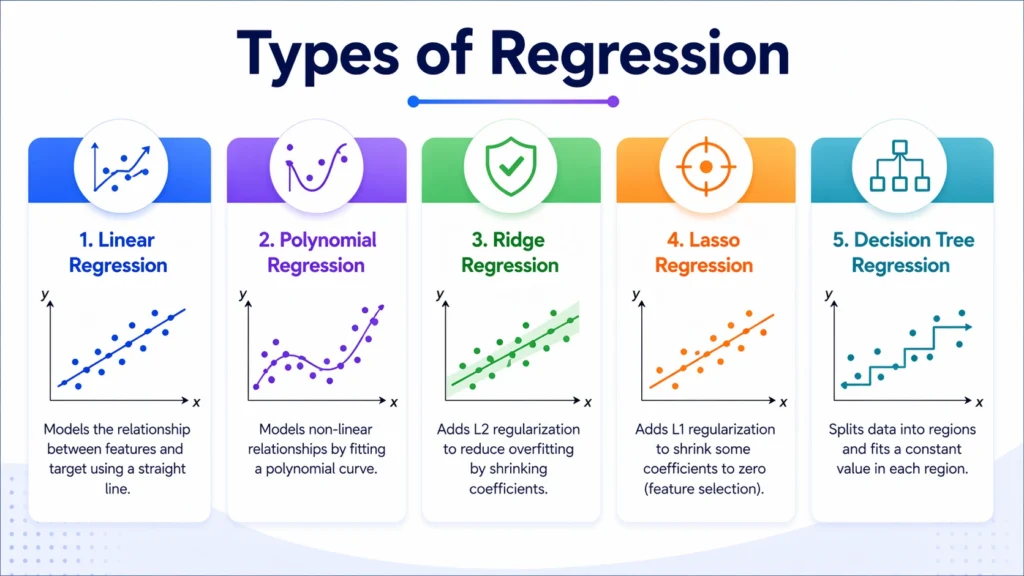
1. Linear Regression
The simplest and most widely used regression technique.
- Models relationship using a straight line
- Used when data has a linear relationship
Formula:
![]()
Example: Predicting salary based on years of experience.
2. Multiple Linear Regression
- Uses multiple input variables
- More realistic for real-world problems
Example: Predicting house price using size, location, and number of rooms
2. Multiple Linear Regression
- Uses multiple input variables
- More realistic for real-world problems
Example: Predicting house price using size, location, and number of rooms
3. Polynomial Regression
- Used when data has a non-linear relationship
- Fits a curve instead of a straight line
4. Ridge Regression
- Handles multicollinearity
- Uses regularization to reduce overfitting
5. Lasso Regression
- Performs feature selection
- Reduces less important features to zero
6. ElasticNet Regression
- Combination of Ridge and Lasso
- Balances regularization and feature selection
7. Decision Tree Regression
- Uses tree based approach
- Handles non linear data
8. Random Forest Regression
- Ensemble method using multiple decision trees
- Improves accuracy and reduces overfitting
Difference between Training, Testing and Validation Sets

How Regression Works in Machine Learning
Regression works by learning the relationship between input features and output values.
Steps:
- Input data (features + target)
- Model training
- Finding best-fit line/curve
- Minimizing error (difference between actual and predicted values)
- Predicting new values
Important Concepts in Regression
- Dependent Variable (Target): Output variable and What we want to predict.
- Independent Variables (Features): Include Input variables which is used to predict output.
- Regression Line: Best fit line through data points
- Error (Residual): Difference between actual and predicted value
- Cost Function: Measures model performance like Mean Squared Error (MSE)
Regression vs Classification in Machine Learning
| Feature | Regression | Classification |
|---|---|---|
| Output | Continuous values | Categories |
| Example | Price prediction | Spam detection |
| Type | Supervised learning | Supervised learning |
Applications of Regression in Machine Learning
- Finance: Stock price prediction and risk analysis.
- Business: Sales forecasting and revenue prediction.
- Healthcare: Disease progression prediction
- Marketing: Customer behavior analysis
- Real Estate: Property price estimation
Practical Implementation in Python
import numpy as np
from sklearn.linear_model import LinearRegression

# Sample data
X = np.array([1, 2, 3, 4, 5]).reshape(-1, 1)
y = np.array([45, 50, 60, 65, 75])

# Model
model = LinearRegression()
model.fit(X, y)

# Prediction
prediction = model.predict([[6]])

print("Predicted Value:", prediction)
This example shows how regression predicts future values based on patterns.
Advantages of Regression
- Easy to understand and implement
- Provides clear relationship between variables
- Useful for prediction and forecasting
- Works well with structured data
Limitations of Regression
- Assumes relationship between variables
- Sensitive to outliers
- May not work well with complex non linear data
- Requires proper feature selection
Real World Example of Regression in Machine Learning
Consider predicting house prices:
- Features: location, size, number of rooms
- Output: price
The model learns relationships and predicts price for new properties. This is one of the most common regression use cases.
The conclusion is….
Regression analysis in machine learning is a foundational technique that enables predictive modeling and data driven decision making.
- By understanding relationships between variables, regression helps in forecasting trends, analyzing patterns, and solving real world problems.
- From simple linear regression to advanced ensemble methods, mastering regression is essential for anyone entering the field of data analytics or machine learning. It not only improves analytical skills but also builds a strong base for advanced machine learning concepts.

Frequently Asked Questions
Answer:
Regression is a supervised learning technique used to predict continuous numerical values based on input features.
Answer:
Regression analysis is a statistical method used to understand relationships between variables and make predictions.
Answer:
Common types include linear, polynomial, ridge, lasso, and random forest regression.
Answer:
Regression predicts continuous values, while classification predicts categories.
Answer:
Regression is used in finance, healthcare, marketing, and business forecasting.

