
Random Variables and its Probability Distributions
Introduction to Random Variables and its Probability Distributions
In probability and statistics, random variables and probability distributions are fundamental concepts that help us understand uncertainty and make decisions. Whether you’re a student, data analyst, or researcher, knowing the difference between a random variable and its probability distribution is crucial.
In this blog, we will explore:
- What is a Random Variable?
- What is the Probability Distribution of a Random Variable?
- How to Find the Mean, Variance, and Standard Deviation of a Random Variable?
- And many more.

What is a Random Variable?
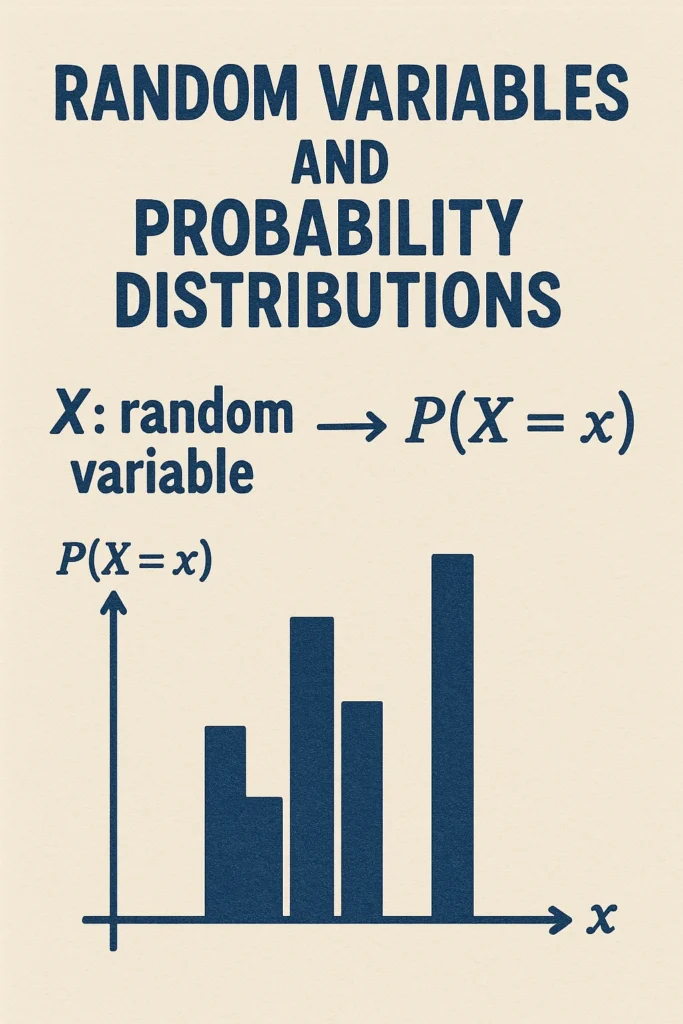
A random variable is a variable that takes on different values based on the outcome of a random experiment.
There are two types of random variables:
- Discrete Random Variable
- Continuous Random Variable
1. Discrete Random Variable:
- It takes specific values (usually integers).
- Example: The number of heads when flipping a coin three times.
2. Continuous Random Variable:
- It can take any value within a given range.
- Example: The height of students in a class or the time taken to complete a task.
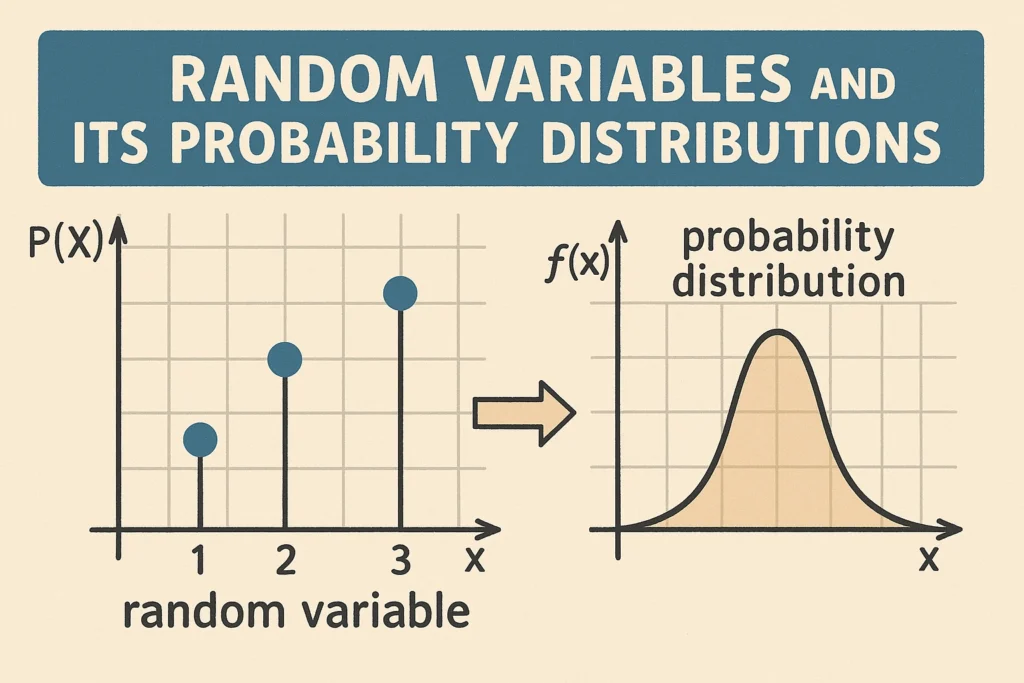

Probability Distribution of a Random Variable
The probability distribution tells us how the probabilities are distributed over the values of the random variable.
In simple words:
- It’s a table, formula, or graph that assigns probabilities to every possible value of a random variable.
For Discrete Random Variables:
- We use something called the Probability Mass Function (PMF). It assigns a probability to each specific value.
Example:
| X (Number of Heads) | P(X) |
|---|---|
| 0 | 0.125 |
| 1 | 0.375 |
| 2 | 0.375 |
| 3 | 0.125 |
- Here, X is a random variable representing the number of heads in 3 coin tosses.
For Continuous Random Variables:
We use a Probability Density Function (PDF). Here, the probability of an exact value is 0, but we calculate the probability over a range.
Mean of a Random Variable
The mean or expected value (E[X]) of a random variable tells us the average value you can expect after many repetitions of the experiment.
For Discrete Random Variables:
E[X]=∑(xi x P(xi))
Where:
- xi = possible values of the random variable
- P(xi) = probability of xi.
Example:
If X = {1, 2, 3} and P(X) = {0.2, 0.5, 0.3}
E[X] = 1(0.2)+2(0.5)+3(0.3)=0.2+1.0+0.9=2.1
- So, the mean is 2.1.
To Wrap it Up
Understanding the difference between a random variable and its probability distribution is key in probability theory. A random variable gives us the possible outcomes of an experiment in numerical form, while the probability distribution tells us how likely each outcome is.
Once we have this information, we can calculate:
- The mean, which gives the expected value
- The variance, which shows how spread out the values are
- The standard deviation, which measures the typical distance from the mean
These tools are incredibly useful in data science, statistics, and everyday decision-making.
FAQ's
A random variable assigns numerical values to outcomes of a random experiment. A probability distribution shows the probability of each of those values.
- Discrete: Countable values (like number of goals in a match).
- Continuous: Uncountable values in a range (like temperature).
No, Variance is always non-negative because it is the average of squared differences from the mean.
It means all the values are the same, and there is no variation in the random variable.

