
Random Variable vs Probability Distribution
Random Variable vs Probability Distribution in Data Analytics
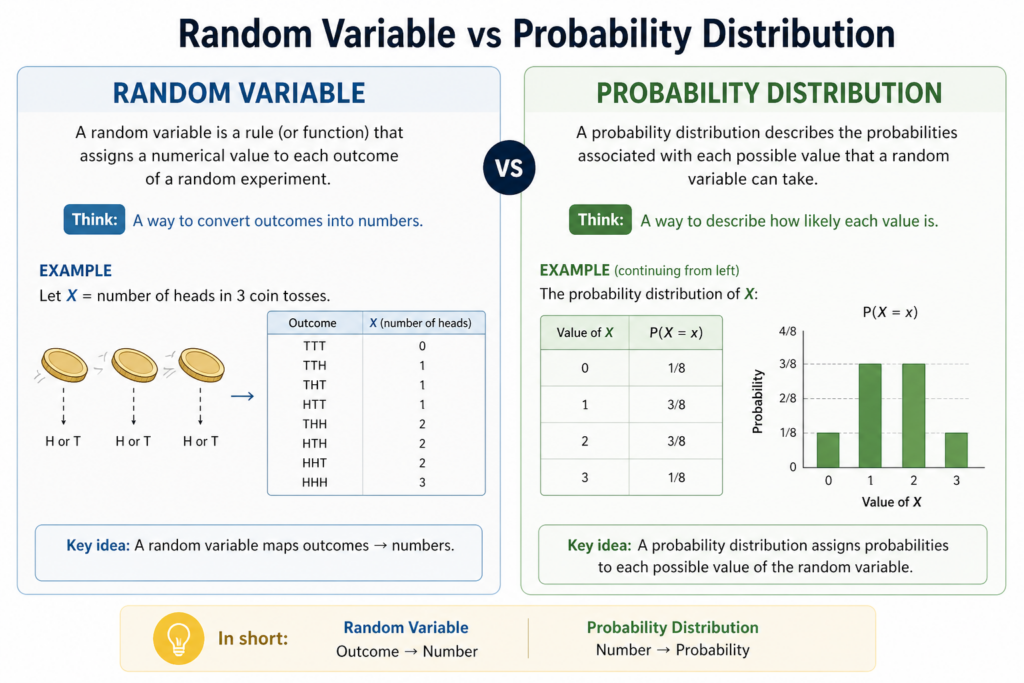
In data analytics, understanding the difference between a random variable and a probability distribution is crucial for analyzing uncertainty, building models, and making data-driven decisions. These concepts are widely used in predictive analytics, machine learning, and statistical modeling.
- A random variable represents a measurable outcome from data (e.g., sales, clicks, user sessions).
- A probability distribution explains how those outcomes are spread and how likely they are.
- In analytics terms:
- Random Variable = Data point or metric
- Probability Distribution = Pattern of that data

What is a Random Variable in Data Analytics?
A random variable is a numerical representation of a real-world event, outcome, or measurable metric whose value can change depending on chance or underlying conditions. In data analytics, it acts as a bridge between raw data and mathematical models, allowing analysts to quantify uncertainty, identify patterns, and make data-driven decisions.
Instead of dealing with vague or unpredictable events, random variables convert outcomes into numbers that can be analyzed using statistical methods. This makes them essential for forecasting, risk analysis, machine learning models, and performance tracking.
- Represents measurable data
A random variable assigns numerical values to outcomes, making it easier to analyze real-world scenarios like sales, clicks, or user behavior. - Used to model uncertainty in datasets
It helps analysts understand variability and unpredictability, such as fluctuating traffic or changing customer demand. - Can be derived from raw data
Random variables are often created from collected data points, like logs, transactions, or sensor readings. - Forms the basis of probability distributions
Once defined, a random variable can follow a probability distribution (e.g., normal, binomial), helping in deeper statistical analysis. - Supports predictive analytics
By studying how a random variable behaves, analysts can predict future trends and outcomes.
Types of Random Variables in Data Analytics
In data analytics, random variables are broadly classified into two main types based on the kind of values they can take. Understanding these types is essential for choosing the right statistical methods and building accurate analytical models.
1. Discrete Random Variables
A discrete random variable takes specific, countable values. These values are usually integers and arise from counting processes. In analytics, discrete variables are commonly used when dealing with events that happen in whole numbers.
Key Characteristics:
- Takes finite or countably infinite values
- Values are distinct and separate (no decimals in between)
- Often associated with counting outcomes
- Modeled using distributions like Binomial or Poisson
Examples in Data Analytics:
- Number of users visiting a website per day
- Number of purchases made in an hour
- Number of clicks on an ad campaign
- Number of support tickets raised
Use Case Insight:
Discrete variables are useful when analyzing frequencies, event counts, and performance metrics in dashboards or reports.
2. Continuous Random Variables
A continuous random variable can take any value within a given range, including decimals. These variables come from measurements rather than counting and are widely used in real-world analytics scenarios.
Key Characteristics:
- Takes infinite possible values within an interval
- Includes fractional and decimal values
- Measured rather than counted
- Modeled using distributions like Normal or Exponential
Examples in Data Analytics:
- Time spent on a website (in seconds or minutes)
- Revenue generated per transaction
- Customer lifetime value
- Page load time or response time
Use Case Insight:
Continuous variables are essential for performance analysis, optimization, and predictive modeling where precision matters.

What is a Probability Distribution in Data Analytics?
A probability distribution describes how the values of a random variable are spread across a dataset and how likely each value is to occur. In data analytics, it provides a structured way to understand data behavior, revealing where values are concentrated and how they vary over time.
Instead of just listing data points, a probability distribution summarizes the entire dataset into a meaningful pattern, helping analysts interpret uncertainty and make predictions with confidence.
- Shows frequency or likelihood of values
It explains how often each value appears or the probability of its occurrence within a dataset. - Helps identify patterns and trends
Distributions reveal whether data is skewed, balanced, or clustered around certain values. - Essential for forecasting and predictions
By understanding how data behaves, analysts can estimate future outcomes more accurately. - Supports statistical analysis
Many techniques like hypothesis testing and regression rely on probability distributions. - Improves decision-making
Businesses use distributions to assess risks, optimize processes, and plan strategies.
Types of Probability Distributions in Analytics
In data analytics, probability distributions help describe how data values are spread and how likely different outcomes are. Choosing the right type of distribution is crucial for accurate analysis, forecasting, and model building.
Broadly, probability distributions are divided into discrete and continuous types, with several commonly used distributions under each category.
1. Discrete Probability Distributions
Discrete distributions deal with countable outcomes (whole numbers). These are widely used in scenarios where events are counted.
Common Types:
- Binomial Distribution
Used when there are two possible outcomes (success/failure).
Example: Whether a user clicks an ad or not. - Poisson Distribution
Models the number of events occurring in a fixed interval.
Example: Number of website visits per minute. - Geometric Distribution
Represents the number of trials until the first success.
Example: Number of attempts before a user makes a purchase.
Where It’s Used:
- Counting user actions (clicks, purchases)
- Event tracking and frequency analysis
- A/B testing results
2. Continuous Probability Distributions
Continuous distributions deal with measurable values that can take any number within a range (including decimals).
Common Types:
- Normal Distribution (Gaussian Distribution)
The most widely used distribution, shaped like a bell curve.
Example: User session durations or average revenue. - Exponential Distribution
Models time between events.
Example: Time between user visits. - Uniform Distribution
All outcomes are equally likely.
Example: Random number generation in simulations.
Where It’s Used:
- Performance metrics (time, revenue, latency)
- Predictive modeling and machine learning
- Risk analysis and forecasting
Random Variable vs Probability Distribution
| Feature | Random Variable | Probability Distribution |
|---|---|---|
| Meaning | Data metric that varies | Pattern of that metric |
| Role | Input (data) | Output (insight) |
| Example | Daily sales count | Sales distribution over time |
| Usage | Data collection | Data analysis |
| Goal | Represent uncertainty | Understand behavior |
- Helps in data modeling and forecasting
- Improves decision-making with uncertainty
- Forms the base of machine learning algorithms
- Enables risk analysis and anomaly detection
Conclusion
In data analytics, a random variable represents the data you collect, while a probability distribution reveals the story behind that data. Together, they transform raw numbers into actionable insights, helping businesses predict trends and make smarter decisions.
They form the foundation of statistical modeling, enabling accurate forecasting and data-driven strategies.
Understanding both concepts improves decision-making by turning uncertainty into measurable and interpretable patterns.

Frequently Asked Questions
Answer:
A random variable represents a measurable data point like clicks, sales, or user sessions, while a probability distribution shows how those values are spread and how likely they are. In data analytics, the variable is the raw data, and the distribution is the pattern behind it. Both work together to help analysts understand uncertainty.
Answer:
Random variables are essential because they convert real-world events into numerical values that can be analyzed. They allow analysts to measure performance metrics like revenue, traffic, or engagement. Without random variables, it would be difficult to apply statistical techniques to real datasets.
Answer:
Probability distributions help analysts understand how data behaves over time. They reveal patterns, trends, and variability in datasets, making it easier to forecast future outcomes. In data analytics, they are widely used for predictive modeling and decision-making.
Answer:
Common examples include the number of website visitors per day, number of purchases, and session duration. These values change over time and are not fixed, which makes them random variables. They are the foundation for analyzing user behavior and business performance.
Answer:
The two main types are discrete and continuous probability distributions. Discrete distributions are used for countable data like clicks or sales, while continuous distributions apply to measurable data like time or revenue. Both types are widely used in analytics and machine learning.
Answer:
No, a probability distribution cannot exist without a random variable. The distribution is defined based on the values taken by the random variable. In data analytics, the variable provides the data, and the distribution explains its behavior.

