
Measures of Central Tendency
Understanding Measures of Central Tendency
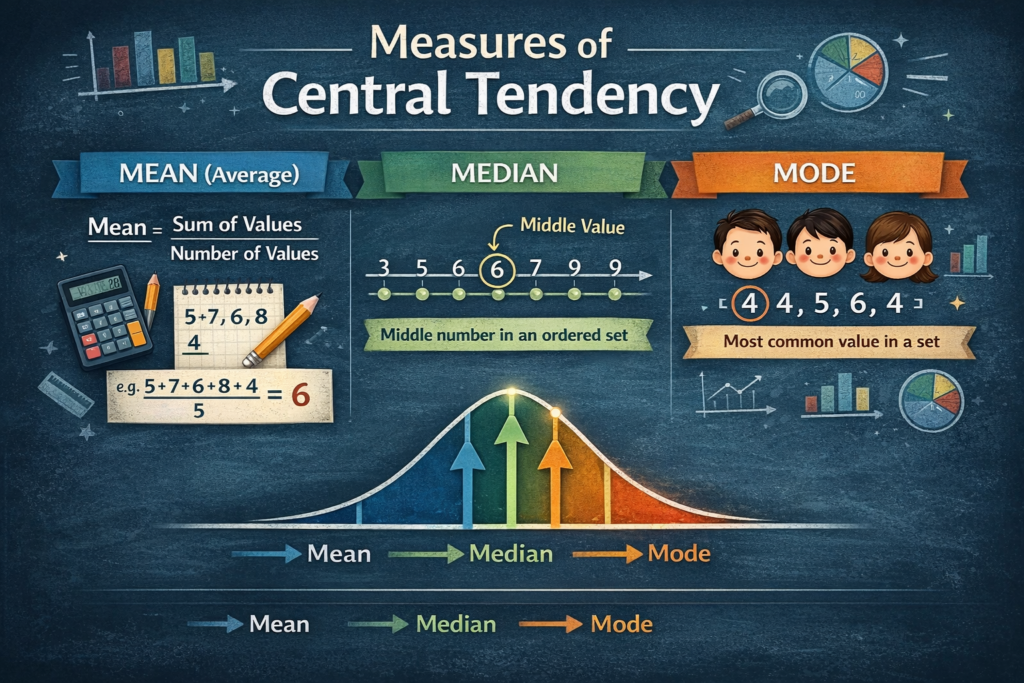
Measures of Central Tendency help summarize data by identifying a single central value. They show the overall trend of a dataset in a simple way. The main types are mean, median, and mode.
These measures are widely used in statistics, data analysis, and business decision-making. This guide explains their meaning, types, and real-life uses in a clear and concise way.
It also helps you understand how to choose the right measure for different types of data. This makes data interpretation more accurate and effective.

What Are Measures of Central Tendency?
The term Central Tendency refers to statistical methods used to determine the center or typical value of a dataset. These measures provide a single representative value that characterizes the entire dataset. The three main measures include:
- Mean (Arithmetic Average)
- Median (Middle Value)
- Mode (Most Frequent Value)
Each of these measures serves a specific purpose and is chosen based on the nature of the dataset and the required analysis.
Mean: The Arithmetic Average
The mean, also known as the arithmetic average, is calculated by adding all values in a dataset and dividing the sum by the total number of values. It is a simple yet powerful way to determine the central value of a given set of numbers.
Formula for Mean:
Where:
- ΣX represents the sum of all values in the dataset.
- N is the total number of values.
Example of Mean Calculation
Consider a dataset representing the test scores of five students: 85, 90, 78, 92, and 88.
- Step 1: Find the Sum of All Values
85+90+78+92+88=433 - Step 2: Divide by the Number of Values
433/5 =86.6
Thus, the mean (average) test score is 86.6.
Advantages of the Mean
- Represents the Overall Dataset: The mean provides a single value that summarizes all data points.
- Useful for Further Analysis: Many statistical methods and formulas rely on the mean for calculations.
- Easy to Compute: The formula is straightforward and can be applied to various datasets.
- Considers Every Data Point: Unlike some other central tendency, the mean takes every value into account, making it more comprehensive.
Disadvantages of the Mean
- Sensitive to Outliers: A few extreme values can significantly affect the mean, making it less representative of the dataset.
- Not Ideal for Skewed Data: In datasets with a highly skewed distribution, the mean may not accurately reflect the typical value.
- Not Suitable for Categorical Data: Since the mean is a numerical measure, it cannot be applied to non-numerical (categorical) data.
Median: The Middle Value
The median is the middle value of a dataset when arranged in ascending order. If the dataset contains an odd number of values, the median is the single middle value. If the dataset contains an even number of values, the median is the average of the two middle values.
The median is particularly useful in datasets that have skewed distributions or contain outliers, as it provides a measure of central tendency that is not influenced by extreme values.
Steps to Find the Median
- Arrange the Dataset in Ascending Order: The values must be sorted from smallest to largest.
- Identify the Middle Value: If the dataset has an odd number of values, the median is the middle number.
- For Even Number of Values: If the dataset has an even number of values, the median is found by calculating the average of the two middle values.
Example of Median Calculation
Example 1: Odd Number of Values
Consider the dataset: 12, 18, 7, 24, 15
- Step 1: Arrange in Ascending Order
7,12,15,18,24 - Step 2: Identify the Middle Value
The middle value is 15, so the median is 15.
Example 2: Even Number of Values
Consider the dataset: 10, 22, 14, 18, 30, 25
- Step 1: Arrange in Ascending Order
10,14,18,22,25,30 - Step 2: Identify the Two Middle Values
The middle values are 18 and 22. - Step 3: Find the Average of the Two Middle Values
18+22/2=40/2=20
Thus, the median is 20.
- Not Affected by Extreme Values: Unlike the mean, the median remains stable even when extreme values are present.
- Useful for Skewed Distributions: In cases where data is not symmetrically distributed, the median provides a better measure of central tendency than the mean.
- Provides a More Accurate Representation in Some Contexts: Particularly useful in real world applications like income or property price analysis.
- Ignores Extreme Values Completely: While avoiding the influence of outliers is a strength, sometimes extreme values contain valuable information that is lost when using the median.
- Does Not Utilize All Data Points in Calculation: Since the median only considers the middle value(s), it does not account for how much individual data points vary.

Mode: The Most Frequent Value
It represents the most frequently occurring value in a dataset. Unlike the mean and median, which are based on numerical calculations, the mode focuses on frequency, making it particularly useful for analyzing categorical, nominal, and ordinal data.
The mode is the value that appears most frequently in a dataset. A dataset can have:
- One mode (Unimodal): A single value appears most frequently.
- Two modes (Bimodal): Two values appear with the highest and equal frequency.
- Multiple modes (Multimodal): More than two values appear with the same highest frequency.
- No mode: If no value repeats, the dataset has no mode.
The mode is particularly useful for analyzing non-numeric data, such as survey responses or product preferences, where other measures like mean and median may not be applicable.
Steps to Find the Mode
- Identify the Frequency of Each Value: Count how many times each value appears in the dataset.
- Determine the Most Frequent Value(s): The mode is the value(s) with the highest occurrence.
Example of Mode Calculation
Example 1: Unimodal Dataset
Consider the dataset: 4, 7, 2, 7, 9, 7, 3
Identify the frequency of each value:
- 2 appears once
- 3 appears once
- 4 appears once
- 7 appears three times
- 9 appears once
Determine the mode:
- The number 7 appears the most, so the mode is 7.
Example 2: Bimodal Dataset
Consider the dataset: 2, 4, 6, 4, 8, 10, 2, 6
Identify the frequency of each value:
- 2 appears twice
- 4 appears twice
- 6 appears twice
- 8 appears once
- 10 appears once
Determine the mode:
- The numbers 2, 4, and 6 each appear twice.
- Since multiple values have the highest frequency, the dataset is multimodal with modes 2, 4, and 6.
Advantages of Mode
- Useful for Categorical Data: The mode is the only measure of central tendency that can be used for non numeric data, such as survey responses.
- Works Well with Nominal and Ordinal Data: Since it focuses on frequency rather than calculations, it applies to qualitative datasets.
- Easily Identifiable in Small Datasets: Unlike mean and median, the mode can be quickly determined by counting occurrences.
Disadvantages of Mode
- May Not Exist or May Have Multiple Values: Some datasets may have no mode, while others may have more than one, making interpretation complex.
- Not Suitable for Advanced Statistical Analysis: Since the mode only considers frequency, it lacks the mathematical properties required for deeper statistical analysis.
- Less Useful for Continuous Data: In datasets with a wide range of values, the mode may not provide a meaningful measure of central tendency.
| Measure | Formula | Suitable For | Affected by Outliers? |
|---|---|---|---|
| Mean | ΣX / N | Symmetric data | Yes |
| Median | Middle value | Skewed data | No |
| Mode | Most frequent value | Categorical data | No |
- Use Mean when the data is normally distributed and has no extreme values.
- Use Median when dealing with skewed distributions or datasets with outliers.
- Use Mode when working with categorical data or to determine the most common value.

Real-Life Applications of Measures of Central Tendency
1. Business and Finance: Companies use the Central Tendency to analyze sales, profits, and customer behavior.
2. Healthcare: Medical researchers use these measures to assess patient recovery rates and disease prevalence.
3. Education: Educators rely on Central Tendency to evaluate student performance through average scores.
4. Sports Analytics: Sports analysts use mean and median to assess player performance and team statistics.
5. Market Research: Survey analysts utilize mode and median to determine consumer preferences.
6. Economics: Economic indicators like GDP and inflation rates often rely on Central Tendency to reflect market trends.
Important Alert: Choosing the Right Measure Matters
Using the wrong Measures of Central Tendency can lead to misleading conclusions. Keep these points in mind:
- Identify the Data Type: Use mean for numerical data, median for skewed data, and mode for categorical data.
- Consider Outliers: Extreme values can distort the mean but have minimal effect on the median and mode.
- Understand Data Distribution: A normal distribution is best analyzed with the mean, while a skewed one requires the median.
- Check for Multiple Modes: If a dataset has multiple peaks, mode may not be the best measure.
- Application Context Matters: Choose the measure that aligns with your analytical goal.
- Use Multiple Measures When Needed: Sometimes, using more than one measure provides a clearer picture.
Understanding the Effect of Distribution Shape on Measures of Central Tendency
The shape of a dataset’s distribution has a significant impact on how the mean, median, and mode behave. These statistical measures are essential for understanding the central value of a dataset, but their reliability and effectiveness vary depending on the distribution type. Recognizing the shape of the distribution allows for the appropriate selection of a measure of central tendency that best represents the data. Below, we explore how different types of distributions affect these measures.
Symmetrical Distribution
In a perfectly symmetrical dataset, all three mean, median, and mode coincide at the center. This means that they provide the same value, making any of them a suitable choice for describing the dataset.
Example:
A normal distribution (also known as a bell curve) is the most common example of a symmetrical distribution.
Positively Skewed Distribution
A positively skewed distribution (also called right-skewed) has a longer tail on the right side, indicating the presence of higher extreme values.
Effects: Mean > Median > Mode
- Since the mean is affected by extreme values, it is pulled to the right, making it larger than the median and mode.
- The median is usually the preferred measure of central tendency in this case, as it is less affected by outliers.
Example:
Income distribution in a population is often positively skewed, where a few extremely high salaries pull the mean upwards.
Negatively Skewed Distribution
A negatively skewed distribution (also called left-skewed) has a longer tail on the left side, indicating the presence of lower extreme values.
Effects: Mode > Median > Mean
- The mean is pulled to the left due to extremely low values, making it the smallest measure.
- The median is usually the best representation of central tendency in this case since it remains resistant to outliers.
Example:
The distribution of test scores in an easy exam, where most students score high but a few get significantly lower marks, can exhibit negative skewness.
Conclusion:
The Measures of Central Tendency are fundamental statistical tools that help summarize data effectively. Understanding when and how to use mean, median, and mode allows for better decision making across various industries. Whether analyzing market trends, academic performance, or healthcare data, selecting the right measure ensures accurate insights and sound conclusions.
Frequently Asked Questions
Answer:
Measures of central tendency are statistical techniques used to identify the central or typical value in a dataset. The three main types are mean, median, and mode. These help summarize large data into a single meaningful value.
Answer:
They help simplify complex datasets by providing a single representative value. This makes it easier to understand patterns, compare data, and make informed decisions. They are widely used in research, business, and data analysis.
Answer:
Mean is the average of all values, median is the middle value when data is arranged, and mode is the most frequent value. Each measure is used in different scenarios depending on the data distribution. Together, they give a complete understanding of the dataset.
Answer:
Median is useful when the dataset contains extreme values or outliers that can distort the mean. It provides a more accurate central value in skewed distributions. This makes it ideal for income data or uneven datasets.
Answer:
A data analytics certification is a credential that proves your ability to analyze and interpret data. It covers tools, techniques, and concepts used in real-world data analysis. This certification helps validate your skills to employers.
Answer:
Yes, it remains valuable as data-driven decision-making is growing across industries. It enhances your practical skills and improves your chances of getting hired. Certifications also help you stay competitive in the job market.
Answer:
A data analyst needs skills like data visualization, statistical analysis, and proficiency in tools like Excel and SQL. Basic knowledge of programming languages such as Python or R is also helpful. Strong problem-solving and analytical thinking are essential.
Answer:
A typical course includes data cleaning, data visualization, and statistical analysis techniques. It also covers tools for creating dashboards and interpreting business insights. Many courses include practical projects to build real-world experience.
Answer:
The duration usually ranges from 3 to 6 months depending on the course and learning pace. Some intensive programs can be completed faster, while part-time options may take longer. Consistent practice is key to completing it successfully.
Answer:
After certification, you can apply for roles such as data analyst, business analyst, or reporting analyst. Opportunities exist in industries like finance, healthcare, marketing, and technology. With experience, you can also move into advanced roles in analytics.

