
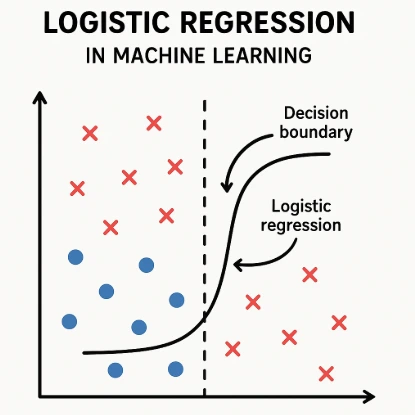
Logistic Regression for Binary Classification

Logistic Regression Equation and Assumptions
Logistic Regression Equation
- The logistic regression model is based on the following equation:
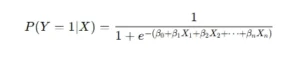
where :
- P(Y=1|X) is the probability of the outcome being 1
- β₀ is the intercept
- β₁, β₂, …, βₙ are the coefficients
- X₁, X₂, …, Xₙ are the input features
The result is passed through the sigmoid function:
Sigma(z) = \frac{1}{1 + e^{-z}}
- This converts the linear combination of features into a probability between 0 and 1.
Assumptions of Logistic Regression
- Binary Output: Logistic regression assumes the outcome is binary (0 or 1).
- Independence of Observations: Each observation should be independent of others.
- No Multicollinearity: Independent variables should not be highly correlated.
- Linearity of Logit: There should be a linear relationship between the log odds and the input variables.
- Large Sample Size: A bigger dataset improves the performance and reliability.


