
Statistical Functions in Tableau
Statistical Functions in Tableau
Statistical functions in Tableau help analysts calculate, summarize, and interpret data directly inside Tableau dashboards and worksheets. These functions are useful when you want to understand averages, variation, ranking, correlation, distribution, and overall data behavior without switching to another tool. In data analytics, statistical functions and analytics in Tableau are commonly used for business reporting, KPI tracking, trend analysis, performance comparison, and decision-making.

What are Statistical Functions in Tableau?
Statistical functions in Tableau are built-in calculation functions used to analyze numerical data. They help summarize large datasets and identify patterns through measures such as average, median, standard deviation, variance, percentile, and correlation.
In simple words, statistical functions help answer questions like:
- What is the average sales value?
- Which product has the highest profit?
- How much variation exists in the data?
- What is the median order value?
- How are two variables related?
- What is the rank of each category?
These functions make Tableau more powerful for data analysis because they allow analysts to calculate insights directly within dashboards.
Why Statistical Functions are Important in Tableau
Statistical functions are important because raw data alone does not always explain the full story. A dashboard becomes more useful when it includes calculated insights, summarized values, and meaningful comparisons.
- Better Data Understanding: Statistical functions help simplify large datasets into useful values like average, median, minimum, maximum, and standard deviation.
- Improved Dashboard Insights: Instead of only showing raw numbers, analysts can show meaningful KPIs and performance indicators.
- Faster Decision Making: Business users can quickly understand trends, variations, and performance differences.
- Stronger Data Analysis: Functions like correlation, percentile, variance, and standard deviation help uncover deeper patterns.
- Less Dependency on External Tools: Many statistical calculations can be performed directly in Tableau without using Excel, Python, or SQL separately.
Common Statistical Functions in Tableau
Tableau provides many functions for statistical and analytical calculations. Below are the most commonly used statistical functions in Tableau.
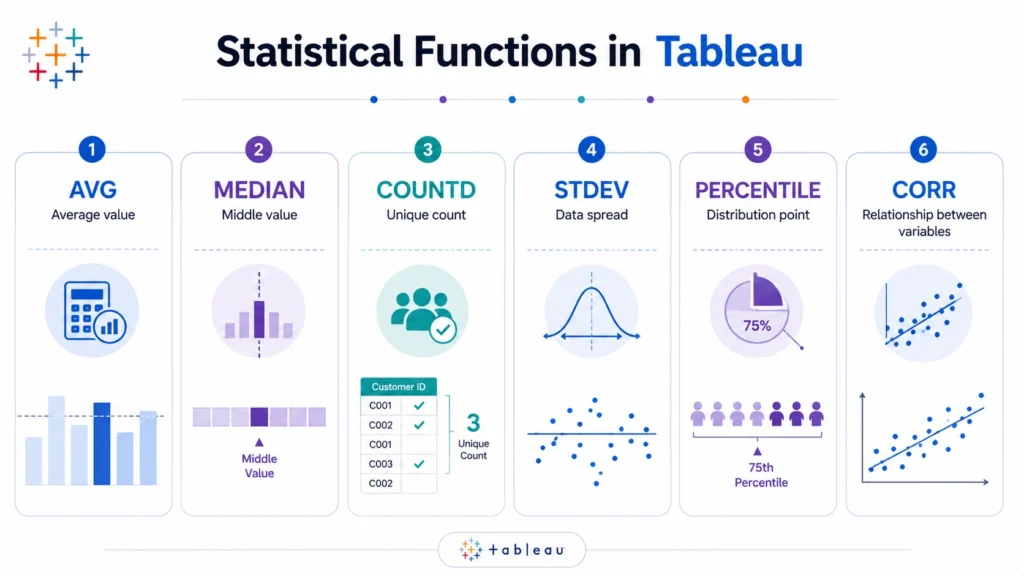
1. AVG Function in Tableau
The AVG() function calculates the average value of a measure.
Example:
AVG([Sales])
This returns the average sales value.
2. MEDIAN Function in Tableau
The MEDIAN() function returns the middle value of a dataset.
Example:
MEDIAN([Sales])
This returns the median sales value.
3. COUNT and COUNTD Functions in Tableau
The COUNT() function counts the number of records, while COUNTD() counts distinct values.
Examples:
COUNT([Order ID])
COUNTD([Customer ID])
Difference:
COUNT() counts all records
COUNTD() counts unique records
4. STDEV Function in Tableau
The STDEV() function calculates standard deviation. Standard deviation measures how spread out values are from the average.
Example:
STDEV([Sales])
5. PERCENTILE Function in Tableau
The PERCENTILE() function returns a value at a specific percentile.
Example:
PERCENTILE([Sales], 0.90)
This returns the 90th percentile of sales.

6. CORR Function in Tableau
The CORR() function calculates correlation between two measures.
Example:
CORR([Sales], [Profit])
Some other useful functions are as follows….
7. SUM Function in Tableau
The SUM() function adds all values in a measure.
Example:
SUM([Sales])
This returns total sales.
8. MIN and MAX Functions in Tableau
The MIN() function returns the smallest value, while the MAX() function returns the largest value.
Examples:
MIN([Sales])
MAX([Sales])
9. VAR Function in Tableau
The VAR() function calculates variance. Variance measures how much data values differ from the mean.
Example:
VAR([Profit])
10. RANK Function in Tableau
The RANK() function ranks values based on measure performance.
Example:
RANK(SUM([Sales]))
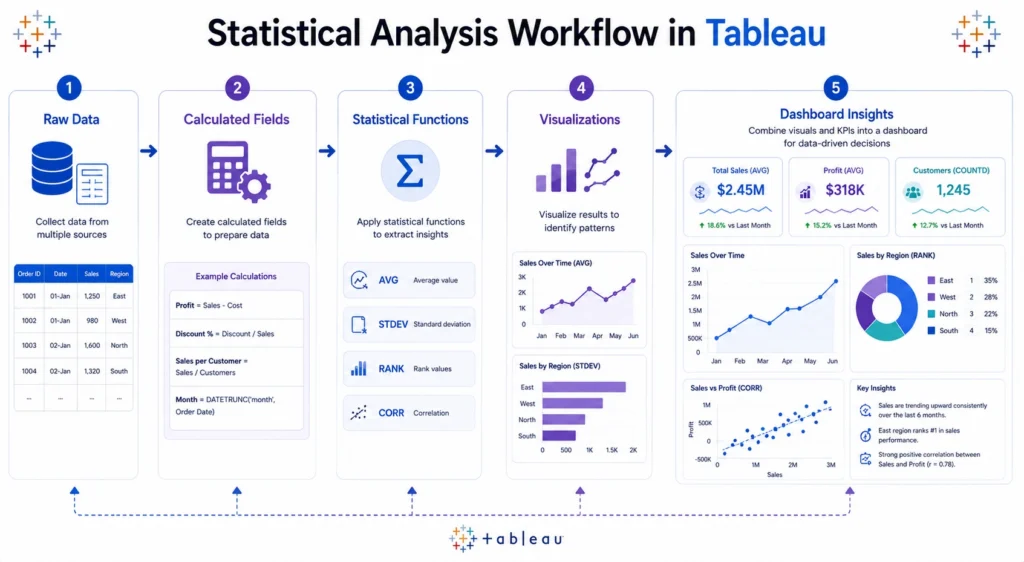
Statistical Functions and Analytics in Tableau
Statistical functions and analytics in Tableau are often used together to build powerful dashboards. For example, an analyst may use:
- SUM to calculate total sales
- AVG to calculate average order value
- COUNTD to count unique customers
- STDEV to measure sales variation
- RANK to identify top products
- CORR to study relationship between sales and profit
When these calculations are combined with visualizations, Tableau becomes a strong analytics tool for business intelligence.
Difference Between Aggregation and Statistical Functions
Many functions in Tableau overlap between aggregation and statistics. However, they are used with slightly different intentions.
| Function Type | Purpose | Examples |
|---|---|---|
| Aggregation Functions | Summarize data | SUM, AVG, COUNT |
| Statistical Functions | Analyze data behavior | MEDIAN, STDEV, VAR, PERCENTILE, CORR |
| Table Calculations | Analyze visible data | RANK, RUNNING_SUM, WINDOW_AVG |
For a beginner, it is enough to remember that statistical functions help explain data patterns, variation, and relationships.
How to Use Statistical Functions in Tableau
You can use statistical functions by creating calculated fields.
Steps:
- Open Tableau workbook.
- Go to the Data Pane.
- Right-click and select “Create Calculated Field”.
- Enter the function formula.
- Click OK.
- Drag the calculated field into the view.
Example:
Average Sales = AVG([Sales])
You can now use this field in charts, dashboards, labels, filters, or KPI cards.
Real World Use Cases of Statistical Functions in Tableau
- Sales Analytics: Statistical functions help analyze total sales, average sales, top products, and sales variation across regions.
- Marketing Analytics: Marketing teams can use Tableau statistical functions to measure campaign performance, customer response, and conversion trends.
- Finance Dashboards: Finance teams use functions like variance, standard deviation, and percentile to analyze revenue, expenses, and risk.
- Customer Analytics: COUNTD, AVG, and percentile functions help analyze unique customers, average spending, and high-value customer groups.
- Operations Analytics: Operations teams can track process performance, delays, order volume, and performance variation
Conclusion….
Statistical functions in Tableau are essential for creating meaningful dashboards and performing deeper data analysis.
- Functions like AVG, MEDIAN, COUNTD, STDEV, VAR, PERCENTILE, CORR, and RANK help analysts summarize data, measure variation, identify relationships, and compare performance.
- By using these functions correctly, Tableau users can move beyond basic charts and create dashboards that explain real business performance clearly.
Whether you are working on sales analytics, finance dashboards, marketing reports, or customer insights, understanding functions in Tableau improves the quality of your analysis and supports better decision-making.
For learners who want structured practice with Tableau, dashboards, and real world analytics projects, Career247’s data analytics course provides guided learning, practical datasets, and hands on exposure to business analytics workflows, helping you build stronger data analytics skills with confidence……

Frequently Asked Questions
Answer:
Statistical functions in Tableau are built in functions used to calculate and analyze values such as average, median, standard deviation, variance, percentile, ranking, and correlation.
Answer:
Common functions in Tableau include SUM, AVG, MEDIAN, COUNT, COUNTD, MIN, MAX, STDEV, VAR, PERCENTILE, CORR, and RANK.
Answer:
Statistical functions help perform analytics by summarizing data, measuring variation, identifying relationships, and ranking performance inside Tableau dashboards.
Answer:
AVG calculates the average value, while MEDIAN returns the middle value. Median is often better when the data has extreme outliers.
Answer:
Yes, Tableau supports several statistical functions, trend lines, forecasting, clustering, and integration with tools like Python and R for advanced analytics.

