
ETL in Data Analytics
How Data Moves from Source to Dashboard
ETL in Data Analytics is one of the most important concepts working behind the scenes of modern business intelligence and reporting systems. Every day, organizations collect data from websites, mobile apps, CRMs, ERP systems, payment platforms, spreadsheets, and databases. But raw data coming from multiple sources is often incomplete, inconsistent, and difficult to analyze directly.

What is ETL in Data Analytics?
ETL stands for:
- Extract
- Transform
- Load
It is a process used to collect data from multiple sources, prepare it for analysis, and store it in a centralized location such as a data warehouse.
In simple terms:
- ETL helps convert raw business data into analysis-ready data.
- Without ETL, organizations would struggle to combine information from different systems and generate accurate reports.
Why ETL is Important in Data Analytics
Imagine a retail company that stores data in multiple systems:
- Sales data in a POS system
- Customer data in a CRM
- Marketing data in advertising platforms
- Inventory data in an ERP system
Each system uses different formats and structures.
ETL helps bring all this information together so analysts can work with a unified dataset.
Benefits include:
- Better data quality
- Consistent reporting
- Faster analysis
- Reduced manual work
- More reliable dashboards
- Improved decision making
Without ETL, business reports often become inconsistent and difficult to trust
Understanding the ETL Process
Step 1: Extract
The first stage involves collecting data from various sources.
Common data sources include:
- SQL Databases
- Excel Files
- Cloud Applications
- CRM Platforms
- ERP Systems
- APIs
- Web Applications
The goal is to retrieve relevant data without affecting the performance of the source systems.
Example:
A company may extract:
- Customer records
- Sales transactions
- Marketing campaign data
- Inventory information
from multiple platforms every day.
Step 2: Transform
This is where raw data becomes useful. During transformation, data is:
- Cleaned
- Validated
- Standardized
- Filtered
- Aggregated
Transformation ensures that information from different systems follows consistent rules.
Example:
A company may discover:
- Duplicate customer records
- Missing values
- Different date formats
- Inconsistent product names
These issues are corrected during the transformation stage.
This step often consumes the largest portion of the ETL process because data quality directly affects analysis quality.
Step 3: Load
After transformation, the prepared data is loaded into a destination system.
Common destinations include:
- Data Warehouses
- Data Marts
- Business Intelligence Platforms
- Analytics Databases
Once loaded, analysts can use SQL, Power BI, Tableau, or other tools to perform analysis and create dashboards.
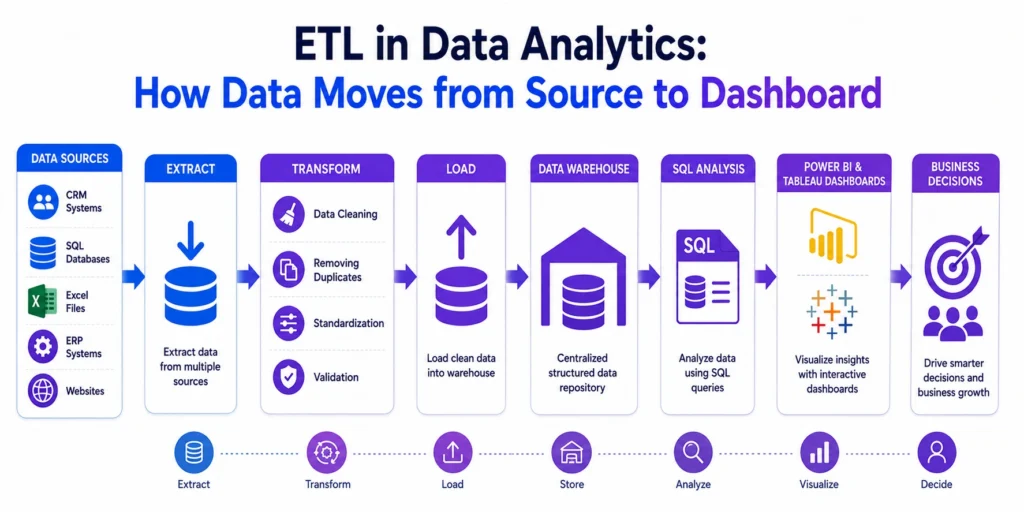
ETL Workflow: From Source to Dashboard
A simplified ETL workflow looks like this:
| Stage | Purpose |
|---|---|
| Data Sources | Collect business data |
| Extract | Retrieve data from systems |
| Transform | Clean and standardize data |
| Load | Store prepared data |
| Analysis | Generate insights |
| Dashboard | Visualize business performance |
This workflow powers most modern analytics environments.
Real World Example of ETL in Business
Consider an e-commerce company.
Every day it collects information from:
- Website visitors
- Customer purchases
- Payment systems
- Marketing campaigns
Raw data from these systems cannot be analyzed immediately.
ETL helps:
- Extract data from all platforms.
- Remove duplicates and errors.
- Standardize product and customer information.
- Load clean data into a warehouse.
- Create dashboards for leadership teams.
The final dashboard might display:
- Daily Revenue
- Customer Acquisition
- Conversion Rates
- Best Selling Products
- Marketing ROI
Without ETL, producing these insights would be far more difficult.

ETL vs ELT: What's the Difference?
As cloud technologies have evolved, many organizations now use ELT instead of traditional ETL.
| Feature | ETL | ELT |
|---|---|---|
| Transformation | Before Loading | After Loading |
| Processing Location | ETL Tool | Data Warehouse |
| Traditional Usage | On-Premise Systems | Cloud Platforms |
| Data Volume | Moderate | Large Scale |
| Flexibility | Moderate | High |
While ELT is growing in popularity, ETL remains a foundational concept for understanding data pipelines and analytics workflows.
Common ETL Tools Used by Businesses
Organizations use specialized tools to automate ETL processes.
Popular ETL tools include:
- Talend
- Informatica
- Microsoft SSIS
- AWS Glue
- Apache Airflow
- Fivetran
- Azure Data Factory
These tools reduce manual effort and improve data consistency across the organization.
ETL and Business Intelligence
Business Intelligence tools such as Power BI and Tableau rely heavily on clean, reliable data.
A dashboard is only as good as the data behind it.
The typical BI workflow looks like:
Data Sources → ETL Process → Data Warehouse → SQL Analysis → Dashboard → Business Decisions
This explains why ETL is considered a critical component of modern business intelligence systems.
Why Data Analysts Should Understand ETL
Not every Data Analyst builds ETL pipelines, but understanding the process is extremely valuable.
It helps analysts:
- Understand where data originates
- Improve data validation skills
- Identify reporting issues faster
- Work effectively with data engineers
- Build more accurate dashboards
As analytics teams become increasingly data driven, ETL knowledge has become a useful skill across Data Analyst, Business Analyst, and Business Intelligence roles.
Conclusion is….
ETL serves as the foundation of modern data analytics. Before insights appear in dashboards or reports, data must be extracted, transformed, and loaded into a format suitable for analysis.
This process helps organizations improve data quality, unify information from multiple sources, and generate reliable business insights.
For aspiring analysts, understanding ETL provides a clearer picture of how data travels through an organization.
It also helps bridge the gap between databases, business intelligence tools, and decision making systems that power modern analytics.
Modern analytics professionals are expected to understand more than just dashboards and reports. They need to know how data is collected, prepared, analyzed, and presented to stakeholders.
Career247’s Data Analytics with GenAI Course helps learners build practical skills in SQL, Statistics, Python, Power BI, Tableau, Data Visualization, Dashboard Design, and real world analytics projects.
By understanding concepts such as ETL, business intelligence, and data workflows, learners gain hands on exposure to the complete analytics lifecycle used in modern organizations.

Frequently Asked Questions
Answer:
ETL stands for Extract, Transform, and Load. It is the process of collecting, cleaning, and preparing data for analysis and reporting.
Answer:
ETL improves data quality, combines information from multiple systems, and ensures analysts work with consistent and reliable datasets.
Answer:
In ETL, data is transformed before loading into a destination system. In ELT, data is loaded first and transformed afterward.
Answer:
While Data Analysts may not build complex ETL pipelines, understanding ETL helps them work more effectively with data and create accurate reports.
Answer:
The best approach is to combine SQL, data cleaning, dashboard development, and real world analytics projects.

