
Descriptive Analysis in Tableau
Descriptive Analysis in Tableau
Descriptive analysis in Tableau helps analysts understand what has already happened in a dataset by summarizing historical data through charts, dashboards, KPIs, and visual reports. It is one of the most important types of data analysis because it provides the foundation for business reporting, performance tracking, and decision making.
As the next connected topic after predictive analysis in Tableau, descriptive analysis focuses on the past and present, while predictive analysis focuses on future trends.

What is Descriptive Analysis in Tableau?
Descriptive analysis in Tableau is the process of using visualizations and summary metrics to explain historical data.
In simple terms, descriptive analysis answers: “What happened?”
For example:
- What were the total sales last month?
- Which region generated the highest revenue?
- What product category performed best?
- How did profit change over time?
- Which customer segment contributed the most?
Tableau helps answer these questions using dashboards, charts, filters, calculated fields, and summary statistics.
Why Descriptive Analysis is Important in Data Analytics
Descriptive analysis is the starting point of any data analytics workflow. Without understanding historical data, it becomes difficult to make accurate predictions or business decisions.
- Helps Understand Past Performance: Businesses use descriptive analysis to review sales, revenue, profit, customer behavior, and operational performance.
- Simplifies Large Datasets: Large datasets can be difficult to understand in raw form. Tableau converts them into charts, tables, and dashboards that are easier to interpret.
- Supports Business Reporting: Descriptive dashboards are commonly used in weekly, monthly, and quarterly reporting.
- Identifies Trends and Patterns: Analysts can easily detect growth, decline, seasonality, and category wise performance.
- Builds the Base for Predictive Analysis: Predictive analysis depends on historical data patterns. Descriptive analysis helps validate those patterns before forecasting.
Descriptive Analysis vs Predictive Analysis in Tableau
Since this topic follows predictive analysis, it is useful to understand the difference clearly.
| Feature | Descriptive Analysis in Tableau | Predictive Analysis in Tableau |
|---|---|---|
| Main Question | What happened? | What may happen next? |
| Focus | Historical data | Future outcomes |
| Output | Reports, summaries, dashboards | Forecasts, trends, predictions |
| Example | Monthly sales dashboard | Future sales forecast |
| Tableau Features | Charts, KPIs, filters, dashboards | Forecasting, trend lines, clustering |
Descriptive analysis explains past performance, while predictive analysis estimates future possibilities.
How Descriptive Analysis Works in Tableau
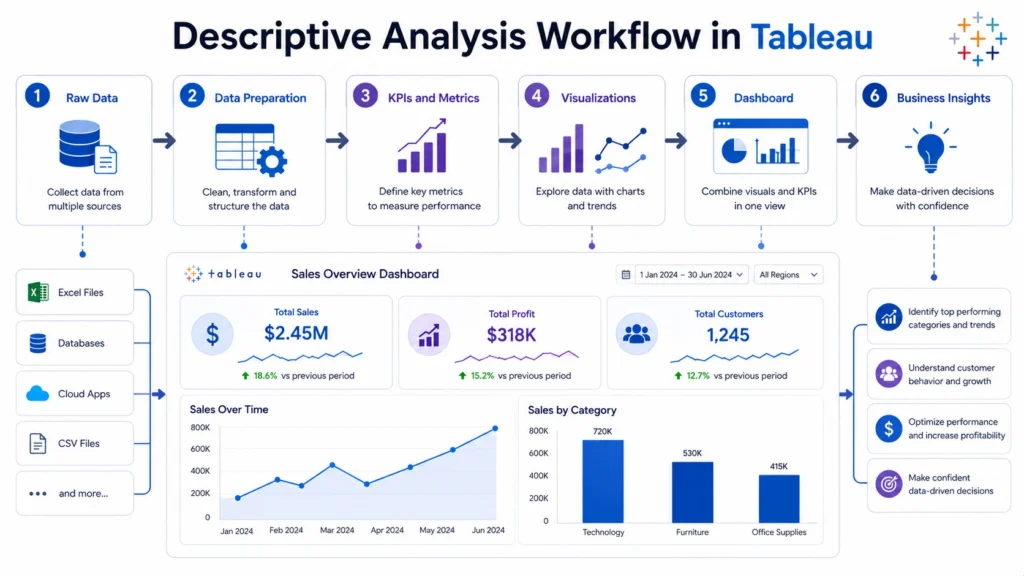
A typical descriptive analysis workflow in Tableau follows these steps:
- Connect to Data: Tableau connects to multiple data sources such as Excel, CSV, SQL databases, cloud platforms, and live data sources.
- Prepare and Organize Data: Before analysis, data should be clean and structured. This may include removing duplicates, fixing data types, and organizing fields.
- Choose Relevant Metrics: Common descriptive metrics include:
- Sales and Profit
- Revenue and Quantity
- Average order value
- Customer count
- Conversion rate
Build Visualizations: Tableau allows users to create bar charts, line charts, pie charts, heat maps, highlight tables, and KPI cards.
Apply Filters and Segmentation: Filters help analyze data by region, date, category, customer segment, or product type.
Create Dashboards: Multiple visualizations are combined into a dashboard for complete business reporting.
Interpret Insights: The final step is to explain what the dashboard shows and how it supports decision making.
Important Tableau Features Used in Descriptive Analysis
- Charts and Graphs
- KPI Cards
- Filters in Tableau
- Groups and Sets
- Calculated Fields
- Dashboards

Common Descriptive Analysis Techniques in Tableau
- Summary Analysis: Summary analysis gives a quick view of key metrics such as total sales, total profit, average sales per order, and customer count. It helps decision makers understand overall business performance.
- Trend Analysis: Trend analysis shows how data changes over time. In Tableau, line charts are commonly used to analyze monthly sales growth, yearly revenue comparison, and seasonal demand patterns.
- Comparative Analysis: Comparative analysis compares different categories or segments, such as region-wise sales, product category performance, or customer segment contribution. Bar charts and highlight tables are useful for this.
- Distribution Analysis: Distribution analysis helps understand how values are spread across a dataset. It is useful for analyzing order value distribution, customer purchase frequency, or profit range using histograms and box plots.
- Ranking Analysis: Ranking analysis identifies top and bottom performers, such as top 10 products, best-performing regions, or lowest profit categories. It helps businesses prioritize actions quickly.
Example of Descriptive Analysis in Tableau
Suppose a company wants to analyze its yearly sales performance.
Dataset includes:
- Order Date
- Sales and Profit
- Region
- Category
- Customer Segment
Analysis process:
- Create KPI cards for total sales and profit
- Build a line chart for monthly sales trends
- Create a bar chart for region-wise sales
- Add a heat map for category performance
- Use filters for region and date
Business outcome: The company can understand which regions performed well, which products generated more profit, and where improvement is needed.
Benefits of Descriptive Analysis in Tableau
- Easy Data Understanding: Tableau converts raw data into visual summaries that are easy to understand.
- Faster Reporting: Dashboards reduce the need for manual reports.
- Better Business Visibility: Teams can track performance in real time or through updated reports.
- Improved Decision Making: Clear insights help businesses make better decisions.
- Strong Foundation for Advanced Analytics: Descriptive analysis prepares users for diagnostic, predictive, and prescriptive analysis.
Limitations of Descriptive Analysis
Descriptive analysis is useful, but it has limitations.
- It Focuses on Past Data: It explains what happened but does not directly predict future outcomes.
- It Does Not Explain Root Causes Fully: For root cause analysis, diagnostic analysis is needed.
- It Depends on Data Quality: Poor data quality can lead to incorrect dashboards and misleading insights.
- It Requires Proper Interpretation: A dashboard is only useful when users understand what the visualizations mean.
Real World Applications of Descriptive Analysis in Tableau
- Sales Reporting: Track total sales, profit, revenue growth, and regional performance.
- Marketing Performance: Analyze campaign performance, website traffic, conversion rates, and customer engagement.
- Finance Dashboards: Monitor expenses, revenue, profit margins, and budget performance.
- Human Resource Analytics: Track employee count, attrition, hiring trends, and department performance.
- Retail Analytics: Analyze product sales, inventory movement, customer segments, and store performance.
- Healthcare Analytics: Summarize patient visits, treatment patterns, department performance, and resource usage.
Conclusion….
Descriptive analysis in Tableau is one of the most essential skills for anyone learning data analytics.
- It helps convert raw historical data into clear visual insights through dashboards, charts, KPIs, and summaries.
- By understanding what has happened in the past, analysts can identify patterns, compare performance, and support better decision making.
As the connected topic before predictive analysis, descriptive analysis builds the foundation for advanced analytics. Once you understand historical trends clearly, it becomes easier to move toward forecasting, trend analysis, and predictive insights.

Frequently Asked Questions
Answer:
Descriptive analysis in Tableau is the process of analyzing historical data using charts, dashboards, KPIs, and summaries to understand what has happened in a business or dataset.
Answer:
Descriptive analysis focuses on past data and answers “what happened,” while predictive analysis uses historical patterns to estimate what may happen next.
Answer:
Bar charts, line charts, heat maps, KPI cards, highlight tables, pie charts, histograms, and dashboards are commonly used for descriptive analysis in Tableau.
Answer:
It helps businesses understand performance, identify trends, simplify reporting, and make informed decisions based on historical data.
Answer:
Yes, Tableau is beginner friendly because users can create descriptive dashboards using drag and drop features, filters, and simple visualizations without heavy coding.

