
Degrees of Freedom
Degrees of Freedom in Data Analytics
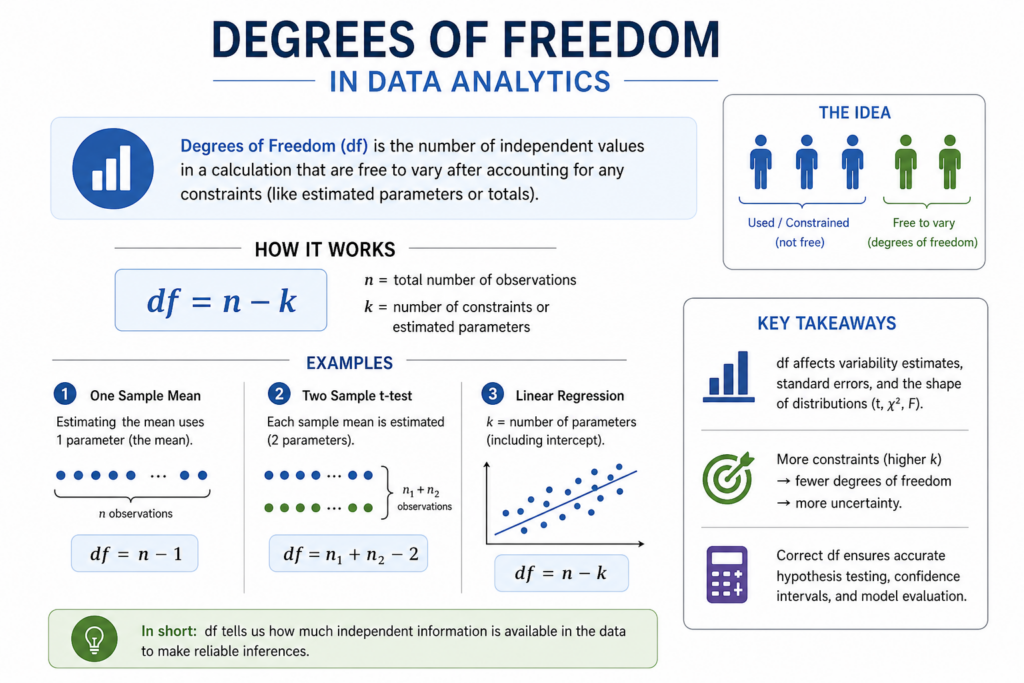
Degrees of Freedom (DoF) in data analytics refer to the number of independent values that can vary when analyzing data under certain constraints. It is a core concept used in statistical modeling, hypothesis testing, and machine learning.
- DoF defines how much flexibility your dataset has during analysis
- It directly affects model accuracy, error estimation, and statistical significance
- Higher DoF leads to better generalization in data models

What is Degrees of Freedom in Data Analytics?
In data analytics, Degrees of Freedom (DoF) refer to the number of independent values in a dataset that are free to vary when estimating statistical parameters or building analytical models after accounting for any constraints applied to the data.
In simpler terms, it tells you how much flexibility your data has left once certain rules or calculations (like the mean) are already fixed.
When you calculate a statistic such as the mean (average), you impose a constraint on the dataset. Once that constraint is set, not all values can vary freely anymore.
- Suppose you have 5 numbers with a fixed mean
- If 4 values are known, the 5th value is automatically determined
- So, only 4 values are free to change
Therefore, Degrees of Freedom = n − 1
Why Degrees of Freedom Matter
Understanding Degrees of Freedom is important because it directly impacts how trustworthy your analysis is.
- Higher DoF → More reliable results
- Lower DoF → Less flexibility, higher risk of error
- Influences confidence intervals and hypothesis testing
- Helps analysts understand data limitations
Degrees of Freedom in Common Analytics Tasks
1. Variance Calculation
- Formula uses n − 1 instead of n
- Ensures an unbiased estimate
2. Regression Models
- DoF = Number of observations − Number of parameters
- More parameters → fewer degrees of freedom
3. Hypothesis Testing
- Determines which statistical distribution to use
- Affects p-values and significance levels

- df = degrees of freedom
- n = number of observations in your dataset
Types of Degrees of Freedom
In data analytics, Degrees of Freedom (DoF) are not limited to a single formula like n − 1. Different analytical scenarios use different types of DoF depending on the method, model, or statistical test being applied. Understanding these types helps you apply the right logic in hypothesis testing, regression, and model evaluation.1. Degrees of Freedom for a Single Sample
This is the most common type used in basic statistics.- Formula: n − 1
- Used when calculating sample mean, variance, and standard deviation
- One constraint (the mean) reduces freedom by 1
2. Degrees of Freedom for Two Samples
Used when comparing two datasets (e.g., A/B testing).- Formula: n₁ + n₂ − 2
- Common in independent t-tests Accounts for estimating two sample means
- Sample A (10 values) + Sample B (12 values)
- DoF = 10 + 12 − 2 = 20
3. Degrees of Freedom in Regression Analysis
In regression, DoF depends on how many predictors (independent variables) you use.- Formula: n − k − 1
- n = number of observations
- k = number of predictors
- Used to evaluate model performance and residual error
4. Degrees of Freedom for Residuals
Residual DoF measures how much unexplained variation remains after fitting a model.- Formula: n − k − 1
- Used in:
- Linear regression
- ANOVA
- Helps assess model accuracy
5. Degrees of Freedom in Chi-Square Tests
Used for categorical data analysis.- Formula: (rows − 1) × (columns − 1)
- Common in:
- Independence tests
- Goodness-of-fit tests
6. Degrees of Freedom in ANOVA (Analysis of Variance)
ANOVA splits DoF into components:- Between Groups DoF: k − 1
- Within Groups DoF: n − k
- Total DoF: n − 1
- k = number of groups
- n = total observations
7. Degrees of Freedom in Model Selection
In advanced analytics and machine learning:- DoF reflects model complexity
- More parameters = fewer degrees of freedom
- Helps balance:
- Bias vs Variance
- Underfitting vs Overfitting
| Type | Formula | Use Case |
|---|---|---|
| Single Sample | n − 1 | Variance, standard deviation |
| Two Sample | n₁ + n₂ − 2 | t-tests |
| Regression | n − k − 1 | Model evaluation |
| Residual | n − k − 1 | Error estimation |
| Chi-Square | (r−1)(c−1) | Categorical analysis |
| ANOVA | k−1, n−k, n−1 | Group comparisons |

- Confusing DoF with sample size
- Ignoring constraints in calculations
- Using wrong formula for different tests
- Not adjusting DoF in regression models
Applications of Degrees of Freedom in Data Analytics
Degrees of Freedom (DoF) play a critical role in statistical analysis and data analytics. They determine how much independent information is available when estimating parameters, which directly impacts the accuracy and reliability of results. Below are the major applications explained in detail:
1. Hypothesis Testing
Degrees of Freedom are essential in statistical tests such as t-tests, chi-square tests, and F-tests.
- They help determine the correct critical values from statistical distribution tables.
- Ensure accurate calculation of p-values for decision-making.
- Influence whether a null hypothesis is accepted or rejected.
- Example: In a one-sample t-test, DoF = n − 1, where n is the sample size.
Without correct DoF, hypothesis testing results can become misleading or incorrect.
2. Confidence Interval Calculation
Degrees of Freedom are used when estimating confidence intervals, especially for small sample sizes.
- Help select the appropriate t-distribution instead of normal distribution.
- Improve the precision of interval estimates.
- Ensure the reliability of population parameter estimates.
- Example: A 95% confidence interval becomes wider or narrower depending on DoF.
Lower degrees of freedom usually lead to wider confidence intervals due to higher uncertainty.
3. Machine Learning Models
In machine learning, Degrees of Freedom relate to model complexity and flexibility.
- Higher DoF means the model can capture more patterns in data.
- Helps balance underfitting vs overfitting.
- Regularization techniques (like Lasso and Ridge) effectively control DoF.
- Used in model evaluation metrics and feature selection.
Managing DoF properly leads to better generalization on unseen data.
4. ANOVA (Analysis of Variance)
Degrees of Freedom are fundamental in ANOVA for comparing multiple group means.
- Divided into between-group DoF and within-group DoF.
- Used to calculate the F-statistic.
- Helps determine whether group differences are statistically significant.
- Example: DoF between groups = k − 1, where k is the number of groups.
Accurate DoF ensures valid comparison across multiple datasets.
5. Regression Analysis
Degrees of Freedom are widely used in linear and multiple regression models.
- DoF = n − k − 1, where k is the number of predictors.
- Used to estimate residual variance and standard error.
- Helps evaluate model performance using adjusted R².
- Determines the reliability of regression coefficients.
Incorrect DoF can lead to biased model evaluation and poor predictions.
6. Data Modeling and Prediction
Degrees of Freedom are crucial in building predictive models and statistical frameworks.
- Control the flexibility of models to fit data patterns.
- Help avoid overly complex models that memorize data.
- Used in time series analysis and forecasting models.
- Influence bias-variance tradeoff in predictive analytics.
Optimal DoF leads to robust, scalable, and accurate predictive models.
Conclusion
In data analytics, Degrees of Freedom is not just a statistical term it is a foundation for building accurate, reliable, and scalable models. Whether you’re analyzing user behavior, running experiments, or building machine learning models, understanding DoF ensures your insights are trustworthy and data-driven.
Frequently Asked Questions
Answer:
Degrees of Freedom in data analytics refer to the number of independent values that can vary when calculating a statistical measure. It determines how much flexibility your dataset has after applying constraints like mean or model parameters. Understanding DoF helps improve the accuracy of data analysis and statistical results.
Answer:
Degrees of Freedom are crucial because they directly impact the reliability of statistical models and hypothesis testing. It helps in reducing bias, improving variance estimation, and ensuring accurate predictions. In data analytics, higher DoF generally leads to more stable and trustworthy insights.
Answer:
Degrees of Freedom are typically calculated using formulas like n − 1 for simple datasets or n − k − 1 in regression models. Here, n represents total observations and k represents predictors. The formula varies depending on the type of statistical analysis being performed.
Answer:
In machine learning, Degrees of Freedom help control model complexity and prevent overfitting. A model with too many parameters relative to data may have low DoF, leading to poor generalization. Proper use of DoF ensures better model performance and reliable predictions.
Answer:
Degrees of Freedom determine the shape of statistical distributions like the t-distribution and chi-square distribution. It influences critical values and p-values, helping analysts decide whether to accept or reject a hypothesis. This makes DoF essential for accurate decision-making in data analytics.
Answer:
No, Degrees of Freedom are not always equal to n − 1. While this formula is common in variance and basic calculations, other analyses like regression, ANOVA, and chi-square tests use different formulas. The value of DoF depends on the number of constraints and variables involved.

