
Understanding Data Control in Tableau
Understanding Data Control in Tableau
Understanding data control in Tableau is essential for building interactive, flexible, and insightful dashboards. In real world data analytics, raw data is rarely used as-is. Analysts need to filter, segment, and organize data to uncover meaningful patterns. Tableau provides powerful features like filters, sets, bins, and groups that allow users to control how data is displayed and analyzed.
Mastering these tools helps transform static dashboards into dynamic analytical systems where users can explore data efficiently and make better decisions.
What is Data Control in Tableau?
Data control in Tableau refers to techniques used to:
- Filter data
- Segment datasets
- Group similar values
- Categorize continuous data
Basically, it helps you control what data is shown and how it is structured in your visualization.
Why Data Control is Important in Tableau
Using filters, sets, bins, and groups in Tableau provides:
- Better data clarity
- Improved dashboard interactivity
- Focused analysis
- Reduced data noise
- Enhanced user experience
Without data control, dashboards can become cluttered and difficult to interpret.
Types of Data Controls in Tableau
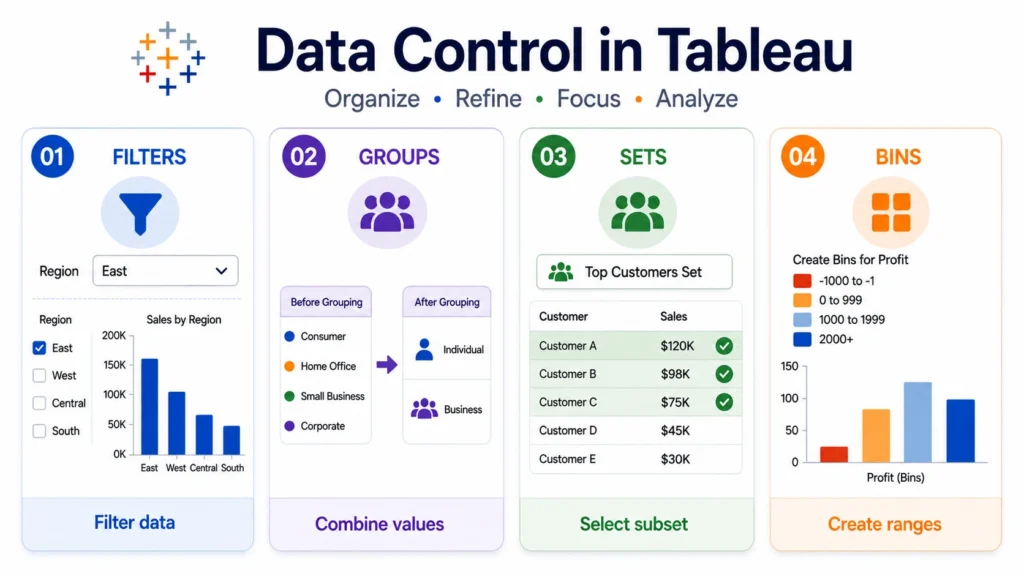
1. Filters in Tableau
Filters are used to restrict the data displayed in a visualization.
Example:
- Show sales only for a specific region
- Filter data by date
Types of Filters in Tableau:
- Extract Filters: Applied while extracting data and reduces dataset size.
- Data Source Filters: Applied at data connection level
- Context Filters: Creates a subset of data for further filtering
- Dimension Filters: Filter categorical data
- Measure Filters: Filter numerical data
2. Improve dashboard performance
3. Enable interactive analysis
2. Groups in Tableau
Groups combine multiple dimension values into a single category.
Example:
- Combine cities into regions
- Group products into categories
Use Cases of Groups:
- Simplify complex data
- Create custom categories
- Improve readability
How to Create Groups?
- Select dimension values
- Right-click → Create Group
3. Sets in Tableau
Sets are subsets of data based on conditions or manual selection. Unlike groups, sets are dynamic and more analytical.
Types of Sets:
- Static Sets: Fixed selection of values
- Dynamic Sets: Based on conditions
Why Use Sets?
- Perform advanced segmentation
- Create comparisons
- Highlight specific data
4. Bins in Tableau
Bins are used to group continuous data into ranges.
Example: Age groups: 0–10, 10–20, 20–30
Why Use Bins?
- Simplify numerical data
- Create histograms
- Analyze distribution
How Bins Work?
- Tableau automatically creates bins
- You can adjust bin size
Filters vs Groups vs Sets vs Bins
| Feature | Filters | Groups | Sets | Bins |
|---|---|---|---|---|
| Purpose | Reduce data | Combine categories | Create subsets | Group numeric ranges |
| Data Type | All | Dimension | Dimension | Measure |
| Dynamic | Yes | No | Yes | No |
| Use Case | Focus data | Simplify data | Advanced segmentation | Distribution |

1. Filters → Control visible data
2. Groups → Simplify categories
3. Sets → Highlight important data
4. Bins → Analyze distributions
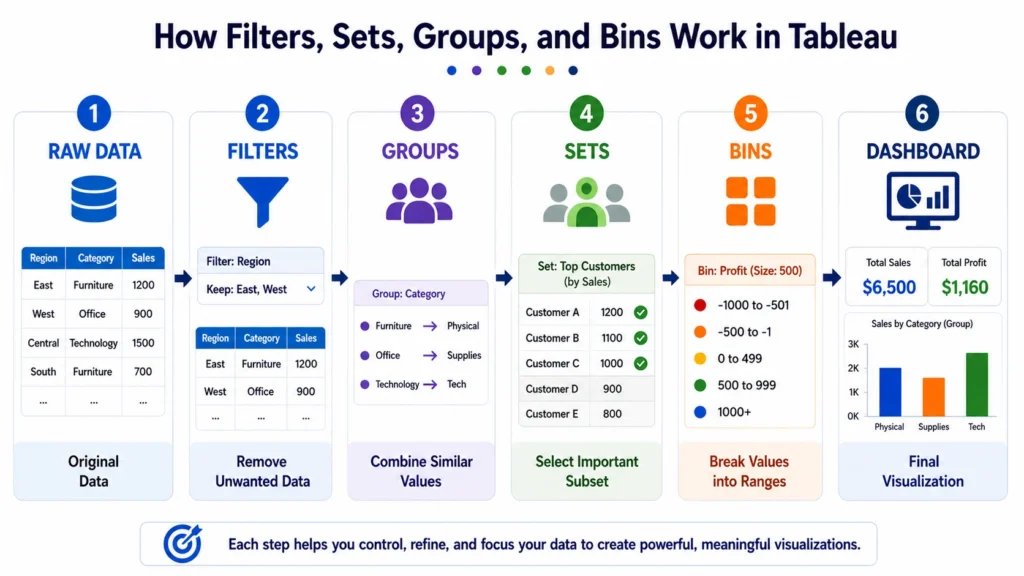
Real World Example of Data Controls in Tableau
A retail dashboard uses:
- Filters → Region selection
- Groups → Product categories
- Sets → Top customers
- Bins → Sales distribution
Result:
- Clear insights
- Better decision making
Best Practices for Data Control in Tableau
- Use filters to reduce clutter
- Avoid over grouping data
- Use sets for comparisons
- Choose appropriate bin sizes
- Keep dashboards user friendly
Common Mistakes to Avoid….
- Overusing filters
- Creating unnecessary groups
- Using sets incorrectly
- Ignoring performance impact
- Poor data segmentation
Conclusion….
Understanding data control in Tableau using filters, sets, bins, and groups is essential for creating effective and interactive dashboards.
These features allow analysts to organize, filter, and segment data in meaningful ways, making it easier to identify trends and insights. By mastering these techniques, you can transform raw data into structured, actionable information and build dashboards that truly support data driven decision making.

Frequently Asked Questions
Answer:
Data control in Tableau refers to using filters, sets, bins, and groups to manage and analyze data effectively.
Answer:
Filters are used to restrict data displayed in a visualization.
Answer:
Groups combine data, while sets create subsets for analysis.
Answer:
Bins group numerical data into ranges for analysis.
Answer:
They help control data, improve clarity, and enhance dashboard interactivity.

