
Advanced Data Blending in Tableau
Data Blending in Tableau
Advanced Data Blending in Tableau is an important technique used when you need to analyze data from multiple sources that are not directly joined in a single database. In real world data analytics, data often comes from different places such as Excel files, SQL databases, cloud platforms, CRM tools, or marketing reports.
Tableau data blending helps combine these separate sources at the visualization level, allowing analysts to compare and analyze related data without physically merging it into one dataset.

What is Data Blending in Tableau?
Data blending in Tableau is the process of combining data from two or more different data sources in a single view.
In Tableau, one data source acts as the primary data source, and the other acts as the secondary data source. Tableau uses a common field, also called a linking field, to connect both sources.
Example:
You may have:
- Sales data in Excel
- Target data in a SQL database
Using data blending, you can compare actual sales with sales targets in the same Tableau visualization.
Why Advanced Data Blending is Important
Advanced data blending in Tableau is useful when datasets come from different systems and cannot be easily joined.
It helps analysts:
- Compare data from multiple sources
- Build dashboards using separate datasets
- Analyze business performance across platforms
- Avoid manual data merging
- Work with different levels of data granularity
For example, sales data may be available at the transaction level, while target data may be available at the monthly region level. Data blending helps combine both without forcing them into the same table structure.
Primary and Secondary Data Sources in Tableau
In data blending, Tableau uses two types of data sources:
1. Primary Data Source
The primary data source is the main source used in the visualization. It defines the level of detail for the view.
Example: If you drag Sales data first into the worksheet, the Sales data becomes the primary source.
2. Secondary Data Source
The secondary data source provides additional fields to support the analysis.
Example: If you later add Target data from another source, it becomes the secondary source.
In Tableau, the primary source usually controls how the data is displayed, while the secondary source is blended based on common fields.
How Data Blending Works in Tableau
Data blending works through a common field between two data sources.
Example:
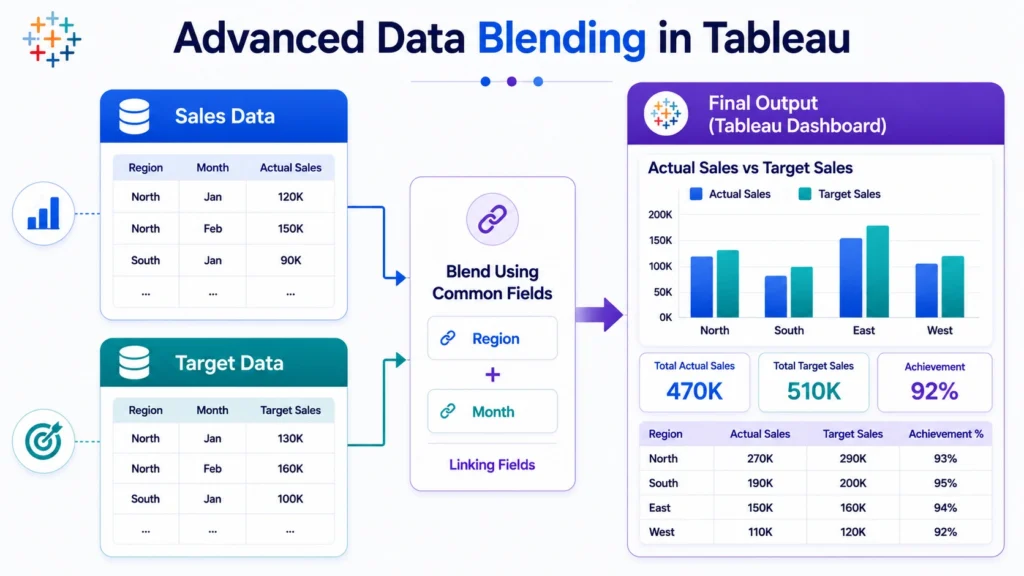
- Sales Data: Region, Month and Sales.
- Target Data: Region, Month and Target.
Here, Region and Month can be used as linking fields.

Data Blending vs Joins in Tableau
Many beginners confuse data blending with joins, but they are different.
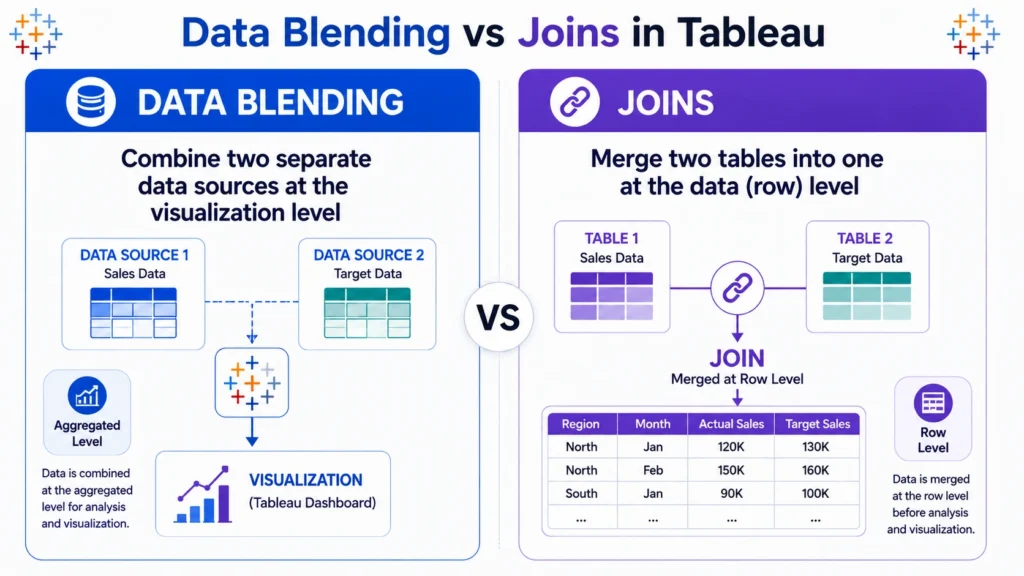
| Feature | Data Blending | Joins |
|---|---|---|
| Level | Aggregated level | Row level |
| Data Sources | Different sources | Usually same database/source |
| Best Use | Combining separate datasets | Combining related tables |
| Control | Primary source controls view | Joined table controls view |
| Flexibility | Good for different granularity | Good for structured data |
Use joins when your tables are in the same database and share a strong row level relationship. Use blending when your data comes from different sources or has different levels of detail.
When to Use Data Blending in Tableau
Data blending is useful when you need to combine related data from different sources without merging them into one table.
Use data blending when:
- Data comes from different sources
Example: Sales from Excel, targets from Google Sheets, and customer data from SQL. - Datasets have different levels of detail
Example: Daily sales data and monthly sales target data. - You need to compare actual vs target
Example: Actual revenue from one source and target revenue from another. - You combine internal and external data
Example: Internal sales data with external market benchmark data. - You need dashboard level analysis
Example: Showing multiple data sources in one dashboard without permanently joining them.
Steps to Perform Data Blending in Tableau
Steps to Perform Data Blending in Tableau….
- Connect to the primary data source
Example: Excel sales file or SQL sales table. - Connect to the secondary data source
Example: Sales target file or customer segment file. - Create a view using the primary source
Example: Drag Region and Sales into the worksheet. - Add fields from the secondary source
Example: Add Target from the second source. - Check linking fields: Tableau may detect common fields automatically. If not, define the relationship manually.
- Validate the result: Check whether values are accurate because incorrect linking fields can create misleading analysis.
Real World Example of Data Blending
Suppose a company wants to analyze regional sales performance.
It has:
- Sales Data: Region, Product, Sales and Date
- Target Data: Region, Month and Sales Target
Using advanced data blending in Tableau, the analyst can create a dashboard showing:
- Actual sales by region
- Monthly sales targets
- Difference between actual and target
- Performance percentage
This helps management quickly understand which regions are performing well and which need attention.
Data Blending vs Relationships in Tableau
Tableau also supports relationships, which are more flexible than traditional joins. Relationships allow Tableau to decide how to combine data based on the fields used in the view.
Still, data blending remains useful when:
- Data comes from completely different sources
- You need view level combination
- You do not want to physically merge datasets
- Sources have different granularity
In many modern Tableau workflows, relationships are preferred for structured data models, while blending is useful for specific cross source analysis.
So the conclusion is….
Advanced data blending in Tableau is a powerful technique for analyzing data from multiple sources without physically merging them.
- It helps analysts compare actuals with targets, combine internal and external data, and build dashboards using datasets with different levels of detail.
- However, successful data blending depends on clean linking fields, correct data types, and proper validation.
- For anyone learning Tableau for data analytics, understanding data blending is important because real world dashboards rarely depend on a single perfect dataset.
For learners looking for a structured path with hands on experience, a guided data analytics course can provide the right direction. Programs like Career247’s data analytics course focus on real world projects, industry relevant tools like Tableau, and step by step learning, helping you strengthen both your technical skills and practical understanding to become job ready in a more efficient and focused way.

Frequently Asked Questions
Answer:
Advanced data blending in Tableau is the process of combining multiple data sources at the visualization level using common linking fields. It is useful when datasets come from different systems or have different levels of detail.
Answer:
Joins combine data at the row level, while data blending combines aggregated data from different sources inside the visualization. Joins are better for structured tables, while blending is useful for separate data sources.
Answer:
Use data blending when your data comes from different sources, such as Excel and SQL, or when datasets have different granularity, such as daily sales data and monthly target data.
Answer:
The primary data source controls the main view, while the secondary data source adds supporting data. Tableau blends both sources using common linking fields.
Answer:
Data blending may fail due to mismatched field names, different data types, missing values, or incorrect linking fields. Always check the relationship between the primary and secondary sources.

