
Data Analysis by Excel, SQL and Python
Data Analysis with Excel, SQL and Python
Data analysis by Excel SQL and Python is one of the most practical ways to understand, process, and interpret business data. These three tools are widely used in real world data analytics because each one plays a different role in the data analysis workflow.
Excel is useful for spreadsheets, quick calculations, and basic reporting. SQL is used to extract and manage data from databases. Python helps perform advanced analysis, automation, and data visualization.

What is Data Analysis by Excel, SQL and Python?
Data analysis by Excel, SQL and Python means using these three tools to collect, clean, organize, analyze, and present data.
Each tool has a specific purpose:
- Excel helps with spreadsheet based analysis and quick reports.
- SQL helps retrieve and manage structured data from databases.
- Python helps automate analysis and handle complex datasets.
Together, they form a complete beginner to practical data analysis toolkit.
For example, a business may store customer data in a database, extract it using SQL, clean and analyze it using Python, and create quick summary reports in Excel.
Why Excel, SQL and Python are Important for Data Analysis
Excel, SQL, and Python are important because most business data is stored, processed, and analyzed using these tools.
Even if a company uses Power BI, Tableau, or advanced AI systems, the foundation of data work often depends on strong knowledge of spreadsheets, databases, and programming-based analysis.
- Excel is Easy to Start With: Excel is beginner friendly and widely used in offices. It helps learners understand basic data analysis concepts such as sorting, filtering, formulas, pivot tables, charts, and reports.
- SQL is Essential for Database Work: Most companies store data in databases. SQL helps analysts extract, filter, join, and summarize this data. Without SQL, working with business databases becomes difficult.
- Python is Powerful for Advanced Analysis: Python is useful for data cleaning, automation, statistical analysis, machine learning, and visualization. It becomes especially important when datasets are large or repetitive tasks need automation.
- Together, They Cover the Complete Workflow: Excel, SQL, and Python together help analysts work across the full data analysis process, from raw data extraction to final insight generation.
Role of Excel in Data Analysis
Excel is one of the most commonly used tools for data analysis. It is especially useful for beginners and business users because it does not require programming knowledge.
Common Uses of Excel in Data Analysis:
Excel is used for:
- Data entry and cleaning
- Sorting and filtering data
- Basic calculations
- Pivot table analysis
- Charts and graphs
- Dashboard creation
- Business reporting
Important Excel Features for Data Analysis
Some important Excel features include:
- Formulas and functions
- Pivot tables
- Conditional formatting
- Data validation
- Charts
- Power Query
- VLOOKUP and XLOOKUP
- Basic dashboards
Example: A sales team can use Excel to calculate monthly revenue, compare product sales, create a pivot table by region, and prepare a simple sales dashboard.
Excel is useful because it allows quick analysis without needing complex setup.
Role of SQL in Data Analysis
SQL, or Structured Query Language, is used to interact with databases. It helps analysts retrieve and organize data stored in relational database systems.
Common Uses of SQL in Data Analysis
SQL is used for:
- Extracting data from databases
- Filtering records
- Joining multiple tables
- Grouping and aggregating data
- Finding trends from structured datasets
- Preparing data for dashboards
Important SQL Concepts for Data Analysis
A beginner should learn:
- SELECT statements
- WHERE clause
- GROUP BY
- ORDER BY
- JOINs
- Aggregate functions
- Subqueries
- Window functions
Example:
SELECT
    region,
    SUM(sales) AS total_sales
FROM orders
GROUP BY region
ORDER BY total_sales DESC;
This query calculates total sales by region and sorts the result from highest to lowest. SQL is important because data analysts often need to work directly with databases before creating reports or dashboards.


Role of Python in Data Analysis
Python is a programming language widely used for data analysis because it is flexible, readable, and supported by powerful libraries.
Common Uses of Python in Data Analysis
Python is used for:
- Cleaning messy datasets
- Automating repetitive tasks
- Performing statistical analysis
- Working with large datasets
- Creating visualizations
- Building machine learning models
- Preparing reports and notebooks
Important Python Libraries for Data Analysis
Common Python libraries include:
- Pandas for data manipulation
- NumPy for numerical operations
- Matplotlib for visualization
- Seaborn for statistical charts
- Scikit learn for machine learning basics
Example Python Code:
import pandas as pd

# Load dataset
df = pd.read_csv("sales_data.csv")

# Calculate total sales by region
summary = df.groupby("Region")["Sales"].sum().reset_index()

print(summary)
This code loads sales data and summarizes total sales by region. Python is useful when Excel becomes limited or when analysis needs automation, advanced calculations, or machine learning.
Excel vs SQL vs Python for Data Analysis
| Tool | Best For | Main Strength | Beginner Difficulty |
|---|---|---|---|
| Excel | Quick reports and spreadsheet analysis | Easy to use | Easy |
| SQL | Database querying and structured data | Extracting and joining data | Moderate |
| Python | Advanced analysis and automation | Flexibility and scalability | Moderate to advanced |
Each tool has its own value. Excel is great for quick business reporting, SQL is essential for database work, and Python is powerful for deeper analysis.
How Excel, SQL and Python Work Together in Data Analysis
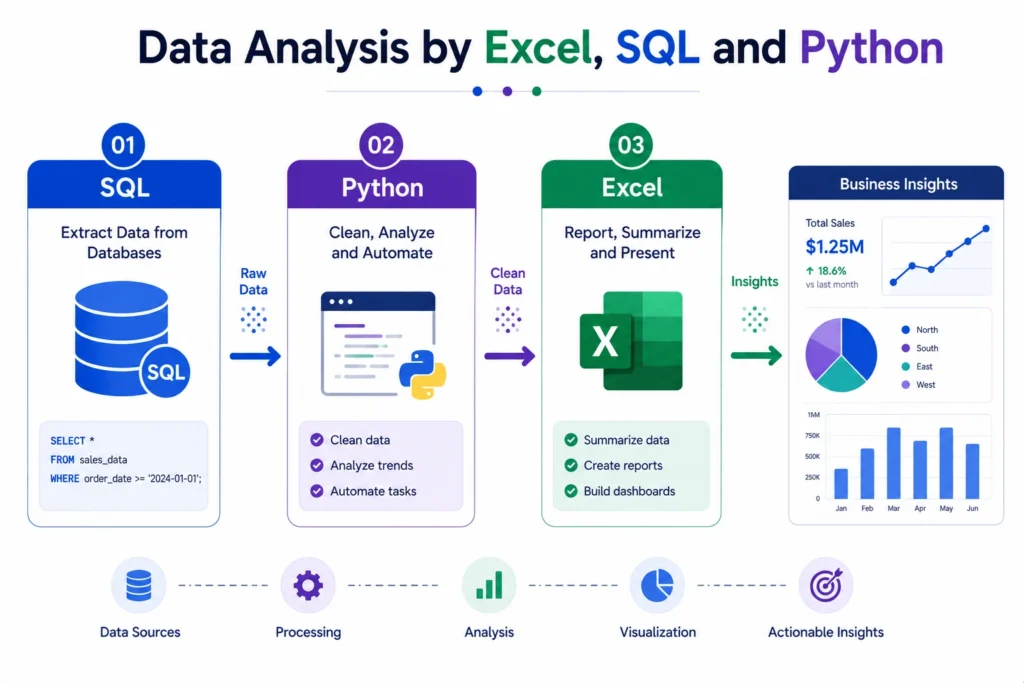
In real projects, Excel, SQL, and Python are often used together rather than separately.
A typical workflow looks like this:
- SQL is used to extract data from databases.
- Python is used to clean, transform, and analyze the data.
- Excel is used for quick reporting, summaries, and stakeholder friendly views.
Example:
A company wants to analyze customer purchases.
- SQL extracts customer and order data.
- Python cleans the data and identifies patterns.
- Excel creates a quick summary report for business teams.
This combined workflow is common in business analytics, finance, marketing, operations, and reporting roles.
Data Analysis Process Using Excel, SQL and Python
1. Define the Business Question
Before using any tool, the analyst must define the problem clearly.
Examples:
- Which region has the highest sales?
- Which product category is underperforming?
- Which customers are most profitable?
- What caused revenue to drop?
Clear questions lead to useful analysis.
2. Collect and Extract Data
- SQL is often used to extract data from databases.
- Excel may also be used when data is available in spreadsheets.
- Python can pull data from files, APIs, and databases.
3. Clean and Prepare Data
- Data cleaning includes removing duplicates, fixing missing values, correcting formats, and organizing columns.
- Excel, SQL, and Python can all be used for cleaning, depending on the complexity.
4. Analyze the Data
- Excel can be used for pivot tables and charts.
- SQL can summarize data using queries.
- Python can perform deeper calculations, statistics, and automation.
5. Visualize the Insights
Excel charts, Python plots, Power BI, or Tableau can be used to show insights visually.
6. Present Business Recommendations
The final step is explaining insights clearly so that teams can take action.
Learning Data Analysis Practically with Career247
For learners who want to build practical skills, learning Excel, SQL, and Python in a structured order is important. Career247’s Data Analytics Course is designed to help beginners understand data analysis through real world projects, guided workflows, dashboards, and hands on practice.
The course focuses on important tools such as Excel, SQL, Python, Tableau, and business analytics. Since Career247’s Data Analytics Course is IBM and NASSCOM certified, it adds professional credibility while helping learners build job ready skills through practical learning.
This is useful for students, freshers, and working professionals who want to understand how data analysis tools are used in real business scenarios.
Which Tool Should Beginners Learn First?
For beginners, the best learning order is:
- Start with Excel: Excel helps you understand data structure, formulas, charts, and basic reporting.
- Learn SQL Next: SQL helps you work with databases and understand how business data is stored and extracted.
- Move to Python: Python helps you perform advanced data analysis, automation, and machine learning basics.
This order is practical because it moves from simple to advanced without overwhelming the learner.
Real World Example of Data Analysis Using Excel, SQL and Python
Conclusion….
Data analysis by Excel, SQL and Python gives learners a strong foundation for working with real business data.
Excel helps with quick reporting and spreadsheet analysis, SQL helps extract and manage database data, and Python supports advanced analysis, automation, and scalable workflows. Together, these tools cover the most important parts of the data analysis process.
For anyone planning to build a career in data analytics, learning Excel, SQL, and Python in a structured way is one of the smartest starting points.
With regular practice, real datasets, and clear business understanding, these tools can help turn raw data into meaningful insights and practical decisions.
Frequently Asked Questions
Answer:
Data analysis by Excel, SQL and Python means using Excel for reports, SQL for database queries, and Python for advanced analysis, automation, and data processing.
Answer:
Excel is useful for basic data analysis, reporting, and dashboards, but SQL and Python are needed for database work, large datasets, automation, and advanced analytics.
Answer:
SQL is important because most business data is stored in databases. It helps analysts extract, filter, join, and summarize structured data.
Answer:
Python is used because it can clean data, automate tasks, perform statistical analysis, create visualizations, and handle large datasets efficiently.
Answer:
Beginners should usually start with Excel, then learn SQL, and finally move to Python for advanced analysis and automation.

