Common Probability Distributions
Different Types of Common Probability Distributions
Common Probability Distributions – Probability distributions are fundamental concepts in statistics and data science, providing a framework for understanding how outcomes are expected to behave in various scenarios.
This article deal with the knowledge of probability distributions, their types, functions, interrelations, and addresses some frequently asked questions to solidify your understanding.

What is a Probability Distribution?
A probability distribution describes how the values of a random variable are distributed. It provides the probabilities of different possible outcomes in an experiment. In simpler terms, it tells us how likely each outcome is.

Example of a Probability Distribution
Consider rolling a six-sided die. The possible outcomes are 1 through 6, each with an equal probability of 1/6. This uniform distribution indicates that each number has an equal chance of appearing.
Need for Probability Distributions
Understanding probability distributions is crucial because they:
- Model Real-World Phenomena: Many natural and human-made processes can be modeled using probability distributions, aiding in predictions and decision-making.
- Facilitate Statistical Inference: They allow statisticians to make inferences about populations based on sample data.
- Support Risk Assessment: In fields like finance and insurance, probability distributions help assess risks and determine policy premiums.
Common Data Types
Data can be broadly categorized into:
- Discrete Data: Consists of distinct, separate values. Examples include the number of children in a family or the result of rolling a die.
- Continuous Data: Can take any value within a range. Examples include height, weight, and temperature.
Types of Probability Distributions
Probability distributions are primarily divided into two categories:
1. Discrete Probability Distributions
These apply to scenarios where the set of possible outcomes is discrete (countable). Common discrete distributions include:
- Bernoulli Distribution: Represents a single trial with two possible outcomes: success (1) or failure (0). For instance, flipping a coin once can be modeled using a Bernoulli distribution.
- Binomial Distribution: Extends the Bernoulli distribution to multiple trials. It models the number of successes in a fixed number of independent trials, each with the same probability of success. For example, the number of heads in 10 coin flips follows a binomial distribution.
- Poisson Distribution: Models the number of times an event occurs in a fixed interval of time or space. It’s often used for counting events like the number of emails received in an hour.
2. Continuous Probability Distributions
These apply to scenarios where the set of possible outcomes is continuous. Common continuous distributions include:
- Normal Distribution: Also known as the Gaussian distribution, it’s characterized by its bell-shaped curve. Many natural phenomena, like heights or test scores, follow a normal distribution.
- Exponential Distribution: Models the time between events in a Poisson process. For example, the time between arrivals of buses at a station can be modeled using an exponential distribution.
- Uniform Distribution: All outcomes are equally likely within a certain range. For instance, if you randomly select a number between 0 and 1, each number has an equal probability of being chosen.

Distribution Function in Probability
The distribution function, or cumulative distribution function (CDF), gives the probability that a random variable is less than or equal to a certain value. Mathematically, for a random variable X and value x:
F(x)=P(X≤x)
- The CDF provides a complete description of the probability distribution of a real-valued random variable.
Relations Between the Distributions
Understanding the relationships between different distributions can provide deeper insights:
- Bernoulli and Binomial: A binomial distribution is essentially the sum of multiple independent Bernoulli trials. If each trial represents flipping a coin, the binomial distribution models the total number of heads in those trials.
- Normal and Binomial: As the number of trials in a binomial distribution increases, and if the probability of success is not too close to 0 or 1, the binomial distribution approaches a normal distribution. This is a result of the Central Limit Theorem.
- Poisson and Exponential: While the Poisson distribution models the number of events in a fixed interval, the exponential distribution models the time between these events. They are two sides of the same coin in Poisson processes.
Test Your Knowledge
1. Normal Random Variable Formula
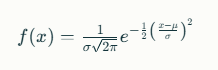
The probability density function (PDF) of a normal random variable X with mean μ and standard deviation σ is given by:
2. Standard Deviation in Bernoulli Distribution
For a Bernoulli distribution with probability of success p, the standard deviation is given by:
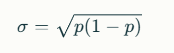
- This formula shows that the variability of a Bernoulli trial increases as p moves away from 0 or 1.
3. Effect of Mean Change in a Normal Distribution
Changing the mean of a normal distribution shifts the entire distribution along the x-axis but does not affect its shape or spread (standard deviation). This means that if you increase the mean, the entire bell curve moves to the right, but its width and height remain unchanged.
To Wrap it Up
Probability distributions are like a roadmap to understanding how likely different outcomes are. They help you choose the right tool for your data, whether it’s a coin flip or measuring heights. By knowing these distributions, you can analyze data more accurately and make better decisions.
Essentially, they’re a guide that shows how your data behaves, allowing for smarter predictions and deeper insights.
FAQ's
The normal distribution is fundamental due to the Central Limit Theorem, which states that the distribution of the sum (or average) of a large number of independent, identically distributed variables approaches a normal distribution, regardless of the original variable’s distribution.
Yes, statistical software like R, Python (with libraries like Matplotlib and Seaborn), and online platforms offer tools to visualize and analyze different probability distributions.