
Central Limit Theorem
Central Limit Theorem in Data Analytics
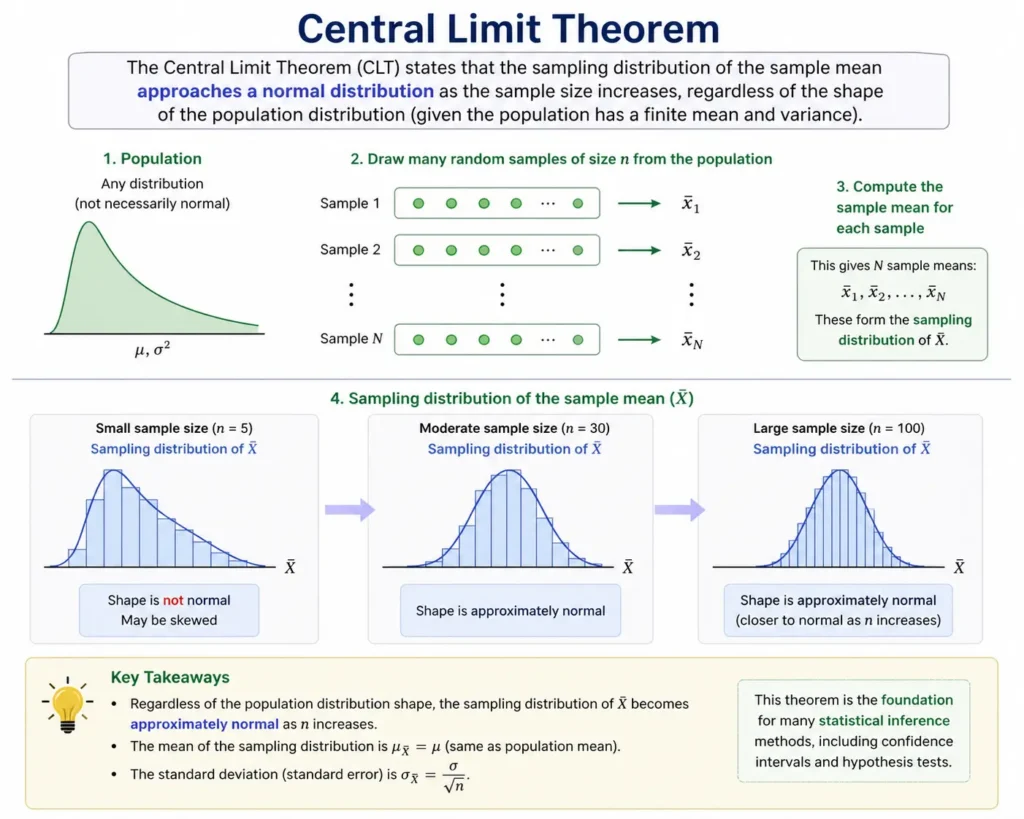
The Central Limit Theorem (CLT) is one of the most powerful concepts in data analytics. It states that when you take multiple random samples from any dataset, the distribution of their sample means will tend to become normal (bell-shaped) as the sample size increases regardless of the original data distribution.
Even if your raw data is messy or skewed, the average of samples behaves predictably.

What is the Central Limit Theorem?
The Central Limit Theorem (CLT) is one of the most powerful concepts in statistics and data analytics. It explains how and why sample data can be used to make reliable predictions about a much larger population. In simple terms, the CLT states that when you repeatedly take samples from any population and calculate their averages, the distribution of those averages will tend to form a normal (bell-shaped) distribution, even if the original data is not normally distributed.
This principle is what allows data analysts, scientists, and businesses to draw meaningful insights from limited data instead of analyzing entire datasets, which is often impractical or impossible.
Central Limit Theorem Formula
\bar{X} \sim N\left(\mu, \frac{\sigma}{\sqrt{n}}\right)
This formula shows that the sampling distribution of the sample mean (X̄) follows a normal distribution with:
- Mean (μ) equal to the population mean
- Standard deviation (σ/√n), also known as the standard error
Detailed Explanation
To understand the Central Limit Theorem more clearly, consider this:
- Imagine a dataset of customer spending that is highly skewed (not normal).
- If you randomly select multiple samples (say 30 or more observations each) and compute their averages,
- Then plot those averages, you will notice something surprising — the distribution of these sample means becomes approximately normal.
This happens regardless of whether the original data is:
- Skewed
- Uniform
- Exponential
- Or irregular in shape
That’s why CLT is extremely valuable in data analytics, machine learning, and statistical modeling.
Key Points of the Central Limit Theorem
- Applies to Sample Means, Not Raw Data
CLT focuses on the distribution of sample averages, not individual data points. - Sample Size Matters (n ≥ 30 Rule)
A sample size of 30 or more is generally considered sufficient for the theorem to hold effectively. - Normal Distribution Emerges
Even if the population data is not normally distributed, the sample mean distribution becomes normal as sample size increases. - Reduces Variability
Larger sample sizes reduce the spread (standard error), making predictions more precise. - Foundation for Statistical Methods
CLT is the backbone of:- Hypothesis testing
- Confidence intervals
- Predictive analytics

Why CLT Matters in Data Analytics
The Central Limit Theorem (CLT) is not just a theoretical concept it plays a critical role in how modern data analytics works. It enables analysts to make accurate, data-driven decisions even when working with limited or incomplete data. Without CLT, many of the statistical techniques used in business intelligence, machine learning, and forecasting would not be reliable.
1. Enables Reliable Predictions from Sample Data
In real-world scenarios, collecting data from an entire population is often impractical. CLT allows analysts to:
- Work with smaller samples
- Still make accurate estimates about the full dataset
- Reduce cost and time in data collection
For example, instead of surveying all customers, businesses can analyze a sample and still predict overall behavior with confidence.
2. Forms the Foundation of Statistical Inference
CLT is the backbone of key statistical methods, including:
- Confidence intervals
- Hypothesis testing
- A/B testing in marketing and product analytics
Because CLT ensures a normal distribution of sample means, analysts can apply standard statistical formulas and make valid conclusions.
3. Simplifies Complex Data Distributions
Real-world data is rarely perfect. It can be:
- Skewed
- Irregular
- Full of outliers
CLT helps normalize this complexity by transforming sample means into a bell-shaped curve, making data easier to analyze and interpret.
4. Improves Decision-Making Accuracy
By reducing variability through larger sample sizes, CLT:
- Minimizes uncertainty
- Improves the precision of estimates
- Helps businesses make better strategic decisions
This is especially useful in finance, healthcare, and e-commerce, where small errors can have large impacts.
5. Powers Machine Learning and Predictive Models
Many machine learning algorithms and predictive models rely on assumptions of normality. CLT supports these models by:
- Ensuring stable data distributions
- Improving model performance
- Making outputs more reliable
6. Supports Risk Analysis and Forecasting
CLT is widely used in:
- Demand forecasting
- Financial risk modeling
- Quality control processes
It allows analysts to estimate probabilities and assess risks even when only sample data is available.

How the Central Limit Theorem Works
Understanding how the Central Limit Theorem (CLT) works becomes much easier when you break it down into a clear, step-by-step process. This process shows how raw, messy data transforms into a predictable normal distribution.
Step-by-Step Process
1. Collect a Dataset (Any Shape Works)
Start with any dataset—it does not need to be normally distributed. It can be:
- Skewed (e.g., income data)
- Uniform
- Random or irregular
Example: Daily website traffic, which may fluctuate heavily and not follow a normal pattern.
2. Draw Multiple Random Samples of Equal Size
From the dataset, take random samples of the same size (commonly n ≥ 30).
- Each sample should be independent
- All samples must have equal observations
Think of selecting multiple groups of users from a large customer base.
3. Calculate the Mean of Each Sample
Now, compute the average (mean) for every sample you selected.
- Each sample will produce one mean value
- These means represent summarized insights from each subset
Instead of analyzing thousands of data points, you’re now working with a set of averages.
4. Plot the Sample Means
Take all the sample means and plot them on a graph.
f(x)=Normal Distribution Curve (Bell Shape)
- As the number of samples increases, the plot forms a bell-shaped curve
- This curve represents a normal distribution
- The center of the curve aligns with the population mean (μ)
Even if your original data is messy and unpredictable, the Central Limit Theorem ensures that the distribution of sample means becomes normal. This is what allows analysts to apply statistical models, make forecasts, and draw reliable conclusions from sample data.
- Sample size should be sufficiently large (n ≥ 30)
- Samples must be independent
- Data should be randomly selected
- Population variance should be finite
CLT vs Normal Distribution
| Feature | Central Limit Theorem | Normal Distribution |
|---|---|---|
| Definition | Theoretical concept | Actual data distribution |
| Purpose | Explains sampling behavior | Describes data shape |
| Dependency | Works on sample means | Applies to raw data |
Conclusion
The Central Limit Theorem in data analytics transforms complex, unpredictable data into a structured and analyzable form. By ensuring that sample means follow a normal distribution, CLT allows analysts to make reliable predictions, test hypotheses, and uncover meaningful insights.
Frequently Asked Questions
Answer:
The Central Limit Theorem (CLT) states that the distribution of sample means becomes approximately normal as the sample size increases. This holds true even if the original population data is not normally distributed. It is a key concept in statistics that helps simplify complex data patterns.
Answer:
The Central Limit Theorem is important because it allows statisticians and data analysts to make inferences about a population using sample data. It ensures that results are more predictable and reliable. This makes it easier to perform hypothesis testing and data-driven decision-making.
Answer:
In most cases, a sample size of 30 or more is considered sufficient for the Central Limit Theorem to apply. However, if the population is already normally distributed, smaller samples can also work effectively. Larger sample sizes generally lead to more accurate results.
Answer:
Yes, the Central Limit Theorem works even if the original data is not normally distributed. Whether the data is skewed or irregular, the sampling distribution of the mean will tend to be normal. This is why CLT is widely used in real-world data analysis.
Answer:
The Central Limit Theorem is used in various fields like finance, healthcare, and marketing. It helps in estimating population parameters, analyzing trends, and making predictions. Businesses use it to improve decision-making and reduce uncertainty.
Answer:
The Central Limit Theorem explains why the sampling distribution of the mean approaches a normal distribution. A normal distribution, however, describes the actual shape of data in a dataset. CLT is a theoretical principle, while normal distribution is a practical representation.

