Introduction to Statistics in Data Analytics
Introduction to Statistics in Data Analytics
Introduction to Statistics in Data Analytics – Statistics is an essential tool in data analytics, which is used to make sense of raw data and extract meaningful insights. It enables data analysts to interpret patterns, trends, and relationships within data, results in better decision-making. Whether it is for business, healthcare, or scientific research or any kind of field, statistics forms the foundation for data optimization strategies.
In this blog, we will explore the basics of statistics, its types, and how it integrates with data analytics.

What are Statistics?
Statistics is the branch of mathematics that deals with collecting, organizing, analyzing, and interpreting numerical data.
- It allows us to draw conclusions and make predictions based on data.
- In core, statistics provides the tools to understand and communicate data effectively.
- It helps in identifying trends, testing hypotheses, and making informed decisions in various fields such as science, business, and social sciences.
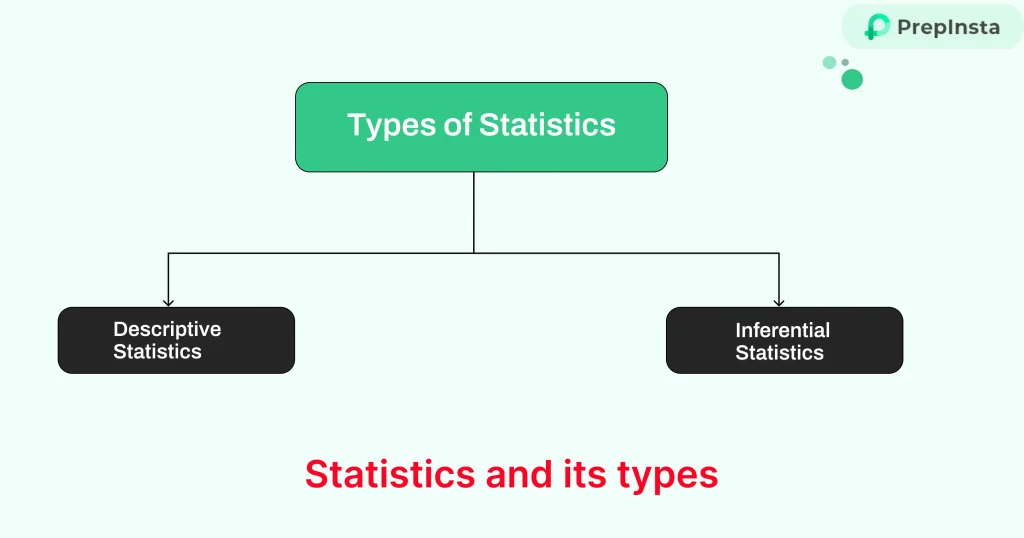
Types of Statistics
Statistics is broadly categorized into two main types:
- Descriptive Statistics – Descriptive statistics focuses on summarizing and organizing data in a meaningful way.
- Inferential Statistics – Inferential statistics goes a step further by making predictions or generalizations about a population based on a sample.
Descriptive Statistics
Descriptive statistics helps in summarizing large datasets into simpler forms, often using:
Inferential Statistics
Inferential statistics uses sample data to infer conclusions about a larger population. Some common techniques include:
Hypothesis Testing
Hypothesis testing is a statistical method used to evaluate assumptions or claims about a population. It involves:
- Null Hypothesis (H₀): A statement of no effect or no difference, assumed true until evidence suggests otherwise.
- Alternative Hypothesis (H₁): A statement indicating the presence of an effect or difference.
- Significance Level (α): The probability threshold to reject the null hypothesis, often set at 0.05.
- P-value: The probability of observing results as extreme as those in the sample if the null hypothesis is true. A lower p-value indicates stronger evidence against the null hypothesis.
Data in Statistics
Data is the backbone of statistics and can be classified into two main types:
- Quantitative Data: Numerical data that can be measured, such as sales figures, temperatures, or test scores.
- Qualitative Data: Categorical data that describes attributes or characteristics, such as customer feedback, colors, or types of products.
Understanding the type of data is crucial for selecting the appropriate statistical methods and tools for analysis.
Representation of Data
Data representation plays a crucial role in understanding statistical information. Common methods include:
- Tables: Organizing data in rows and columns for clarity.
- Charts and Graphs: Visual representations such as bar charts, pie charts, line graphs, and scatter plots.
- Frequency Distributions: Summarizing data into intervals or groups to show the frequency of occurrences.
- Box Plots: Displaying the distribution of data based on a five-number summary (minimum, first quartile, median, third quartile, maximum).

Models of Statistics in Data Analytics
Statistical models are mathematical frameworks used to represent real-world processes. This involves common models like:
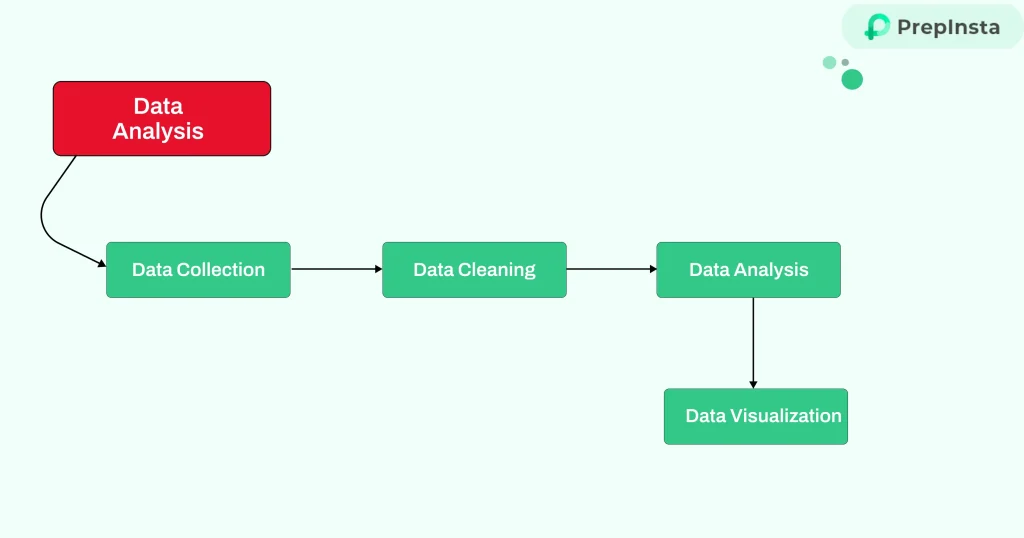
Data Analysis
Data analysis involves processing and examining data to uncover patterns and insights. The main steps include:
- Data Collection: Gathering relevant data from reliable sources.
- Data Cleaning: Identifying and correcting errors or inconsistencies in the data.
- Data Analysis: Applying statistical tools and techniques to interpret the data.
- Data Visualization: Presenting results in charts, graphs, or dashboards for clear communication.
Types of Data Analysis
Coefficient of Variation
The coefficient of variation (CV) measures the relative variability of data compared to its mean. It is calculated as:
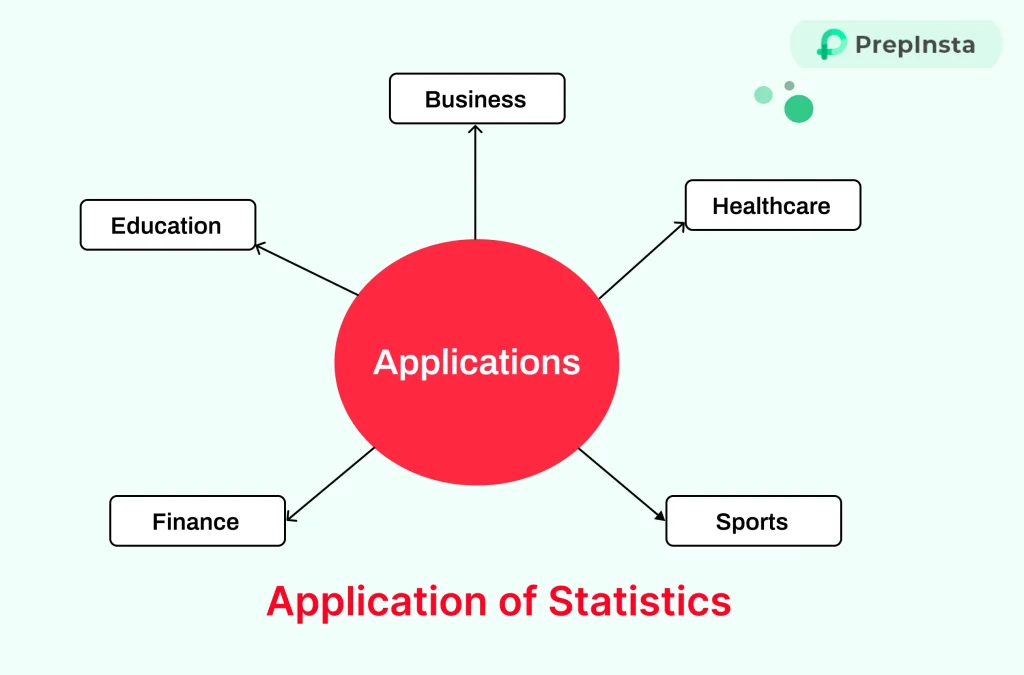
Applications of Statistics
Statistics has a wide range of applications, including:
- Business: Market analysis, forecasting, quality control, and customer segmentation.
- Healthcare: Analyzing treatment effectiveness, predicting disease outbreaks, and patient monitoring.
- Education: Assessing student performance, designing educational programs, and analyzing survey data.
- Finance: Risk assessment, portfolio management, and fraud detection.
- Sports: Evaluating player performance, predicting game outcomes, and analyzing team strategies.
Business Statistics
Business statistics focuses on applying statistical methods to solve business problems. Key areas include:
- Demand Forecasting: Predicting future product demand based on historical data.
- Inventory Management: Optimizing stock levels to minimize costs and meet customer demand.
- Financial Analysis: Analyzing financial data to assess profitability and investment risks.
- Customer Behavior Analysis: Understanding customer preferences and improving marketing strategies.
Scope of Statistics
The scope of statistics extends to almost every field, including:
- Social Sciences: Analyzing survey data, public opinion, and social trends.
- Natural Sciences: Conducting experiments and interpreting results.
- Engineering: Quality control and reliability testing.
- Public Policy: Designing and evaluating programs based on statistical evidence.
- Sports and Entertainment: Performance analysis and audience measurement.
Limitations of Statistics
While powerful, statistics has its limitations:
- Data Dependence: Conclusions are only as accurate as the quality of the data collected.
- Misinterpretation: Incorrect use of statistical methods can lead to false conclusions or misleading results.
- Complexity: Advanced techniques may require specialized knowledge to apply and interpret correctly.
- Assumptions: Many statistical methods rely on assumptions that may not always hold true in real-world scenarios.
Some Problems on Statistics
Problem 1:
Calculate the mean of the dataset: [5, 10, 15, 20, 25].
Solution: The mean of a dataset is calculated using the formula:
Mean = ∑all data points/number of data points
In this case, the dataset is: [5, 10, 15, 20, 25].
Sum of the data points: 5 + 10 + 15 + 20 + 25 = 75
Number of data points = 5.
Now, calculating the mean:
Mean = 75/5 = 15
Answer: The mean is 15.
Problem 2:
If the standard deviation of a dataset is 4 and the mean is 20, what is the coefficient of variation
Solution: The coefficient of variation (CV) is calculated using the formula:
Coefficient of Variation = (Standard Deviation/Mean) × 100
Given:
Standard deviation = 4
Mean = 20
Now, calculating the coefficient of variation:
CV = (4/20) × 100
= 0.2 × 100
= 20%
Answer: The coefficient of variation is 20%.
Final Thoughts
In conclusion, statistics is key to data analytics, helping us understand data, spot trends, and make better decisions. By understanding basic concepts like mean and probability, we can analyze data more effectively and make informed choices.
Unlock your Statistics potential with PrepInsta Prime! Dive into our expertly designed course and master Statistics today. Click now to get started!