
Descriptive Statistics in data analytics
Introduction to Descriptive Statistics in Data Analytics
Data is all around us, but understanding it can often seem overwhelming. Descriptive statistics simplifies this process by offering methods to organize, summarize, and present data in an easy-to-understand way. Whether you’re analyzing sales figures, survey results, or scientific experiments, descriptive statistics provides the tools to make sense of raw numbers.

Descriptive Statistics in Data Analytics
Descriptive statistics is a branch of statistics that deals with summarizing and organizing data in a meaningful way.
- It allows researchers and analysts to present data in an understandable format, making it easier to identify trends, patterns, and insights without diving into every individual data point.
Types of Descriptive Statistics
Descriptive statistics can be categorized into several key areas:
- Measures of Central Tendency
- Measure of Variability
- Measures of Frequency Distribution
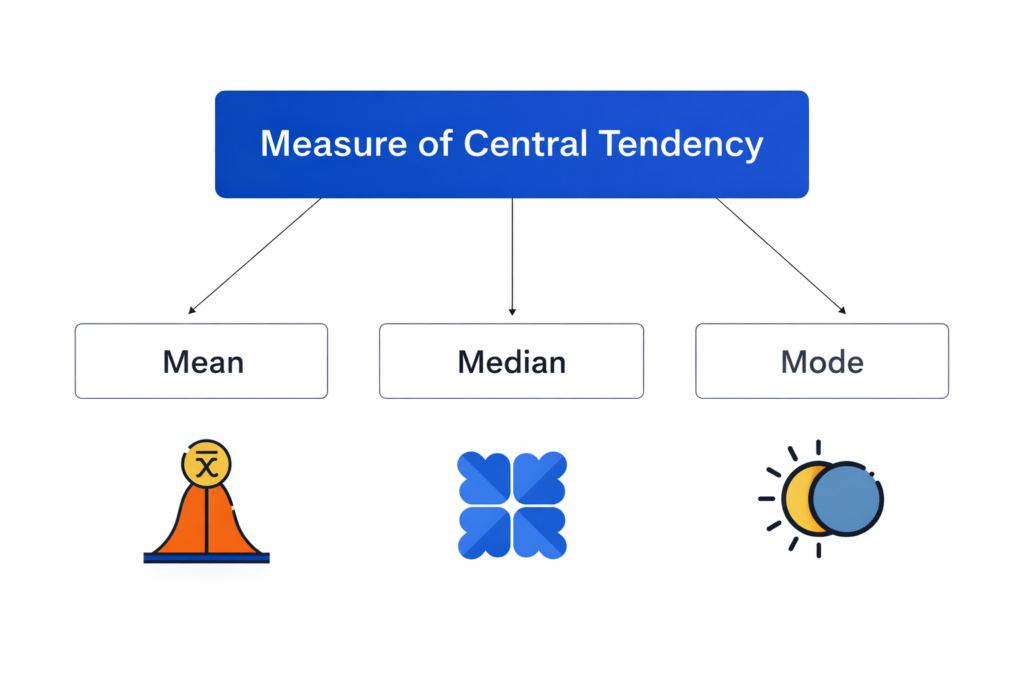
1. Measure of Central Tendency
Measures of central tendency summarize a set of data by identifying the central point within that dataset. The three primary measures are:
- Mean
- Median
- Mode
Mean
The average value calculated by dividing the sum of all observations by the number of observations. It is represented mathematically as:
Mean(μ or ) = (Sum of all values) / (Number of values)
Median:
The median is the middle value when the data is arranged in ascending order.
- If n (total number of observations) is odd, the median is the middle value.
- If n is even, the median is the average of the two middle values.
Steps to Find Median:
- Arrange the data in ascending order.
- Determine the middle value(s).
Mode:
The mode is the value(s) that occurs most frequently in the dataset.
- A dataset can have one mode (unimodal), more than one mode (bimodal/multimodal), or no mode if all values occur with equal frequency.

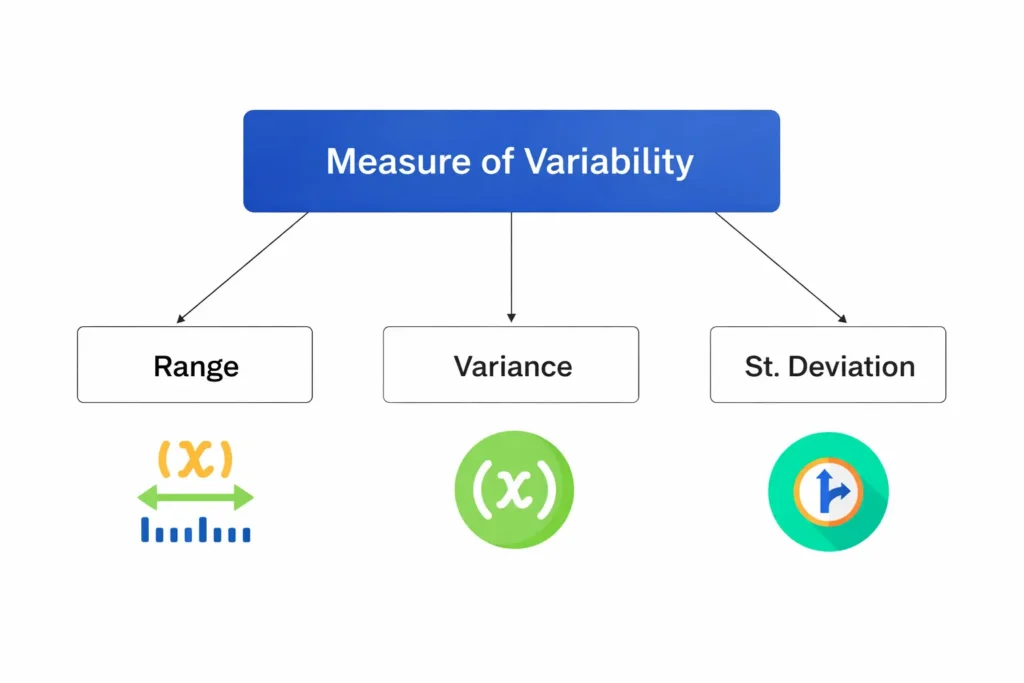
2. Measure of Variability
Measures of variability indicate how much the data points differ from each other and from the central tendency. Key measures include:
- Range
- Variance
- Standard Deviation
Range
The range is the difference between the highest and lowest data values. It provides the simplest measure of data spread.
Formula:
Range = Maximum Value – Minimum Value
Variance:
- A comprehensive measure that calculates the average squared deviation of each data point from the mean.
- It provides insight into how data points deviate from the average but is in squared units, which can make interpretation less intuitive.
Standard Deviation:
- The square root of variance, offering a measure of spread in the same units as the original data.
- It is widely used due to its interpretability and its role in statistical analysis, such as hypothesis testing.
Characteristics of Measures of Variability:
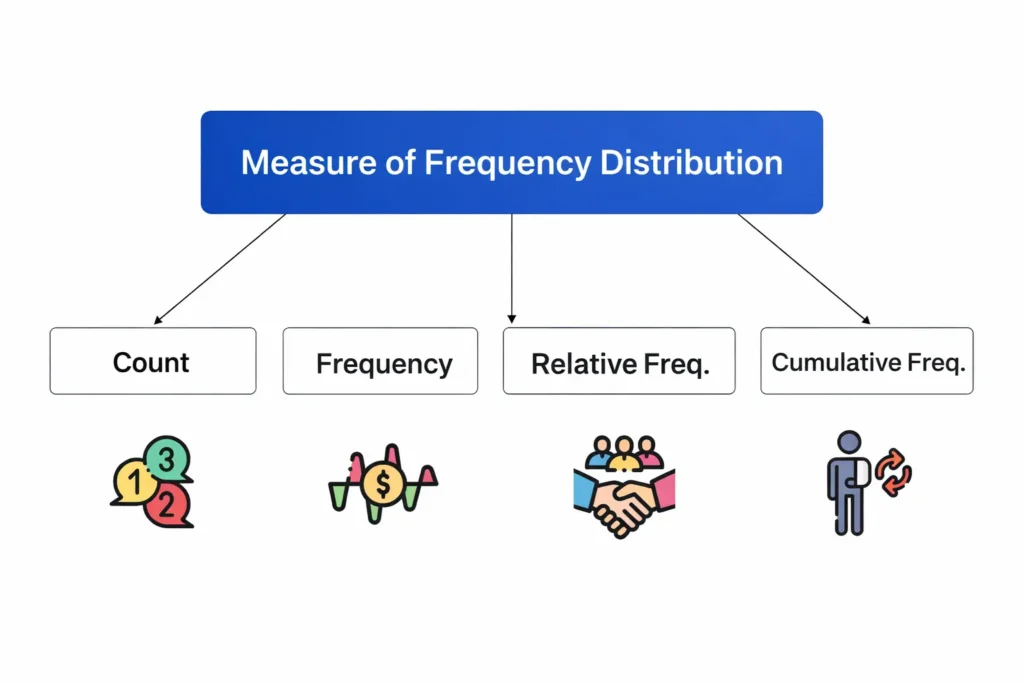
3. Measure of Frequency Distribution
These measures help understand how often different values occur within a dataset:
- Count: The total number of observations.
- Frequency: The number of times each value occurs.
- Relative Frequency: The proportion of total observations that each value represents.
- Cumulative Frequency: A running total of frequencies through the dataset.
Difference between Descriptive Statistics vs. Inferential Statistics
Purpose:
- Descriptive statistics are used to summarize, organize, and describe the main features of a dataset, such as its central values and spread.
- Inferential statistics go beyond the given data and help make predictions or generalizations about a larger population based on a sample.
Scope:
- Descriptive statistics deal only with the specific data you have. They provide a snapshot of that data (e.g., averages, ranges, and graphs).
- Inferential statistics use the sample data to draw conclusions, test hypotheses, or estimate characteristics of the entire population.
Examples:
- Descriptive: “The average height of students in a class is 5.6 feet.”
- Inferential: “Based on this sample, we predict the average height of all students in the school is around 5.6 feet.”
Tools Used:
- Descriptive statistics use measures like mean, median, mode, range, standard deviation, and visual tools like graphs and charts.
- Inferential statistics rely on techniques like hypothesis testing, confidence intervals, regression analysis, and probability.
Data Focus:
- Descriptive statistics focus on the past or current data.
- Inferential statistics aim to make predictions or decisions about future or unknown data.
Final Thoughts
Descriptive statistics play an essential role in data analysis by providing tools to summarize and interpret datasets effectively. By understanding measures such as central tendency, variability, frequency distribution, and differentiating between univariate and bivariate analysis, researchers can gain valuable insights into their data.
Furthermore, distinguishing between descriptive and inferential statistics helps clarify the objectives behind data analysis, whether it’s simply summarizing information or making predictions about future trends.

Frequently Asked Questions
Answer:
Descriptive Statistics in Data Analytics is a method used to summarize, organize, and present data in a meaningful way. It helps analysts understand the basic features of a dataset using measures such as mean, median, mode, standard deviation, and data visualization techniques like charts and graphs.
Answer:
Descriptive Statistics in Data Analytics is important because it helps simplify large volumes of raw data into understandable insights. It allows data analysts to identify patterns, trends, and distributions, which supports better decision-making and data interpretation.
Answer:
The main types of Descriptive Statistics in Data Analytics include:
- Measures of Central Tendency (Mean, Median, Mode)
- Measures of Dispersion (Range, Variance, Standard Deviation)
- Measures of Frequency Distribution
- Data Visualization (Bar charts, histograms, pie charts)
These techniques help in summarizing and explaining data clearly.
Answer:
Descriptive Statistics in Data Analytics focuses on summarizing and describing the characteristics of a dataset, while inferential statistics is used to make predictions or conclusions about a population based on sample data. Descriptive statistics explains what the data shows, whereas inferential statistics predicts what could happen.
Answer:
Common Descriptive Statistics in Data Analytics techniques include:
- Calculating the average sales of a company
- Finding the highest and lowest values in a dataset
- Creating dashboards and reports
- Using data visualization tools to present trends
These techniques help businesses understand their data quickly.
Answer:
In real-world scenarios, Descriptive Statistics in Data Analytics is used in business reporting, market analysis, performance tracking, and customer analytics. Companies use it to analyze KPIs, customer behavior, and financial data to make data-driven decisions.

