
Data Analytics Life Cycle Process
Introduction to Phases of Data Analytics Life Cycle Process
In this blog, we’ll explore phases of Data Analytics Life Cycle and understand them through practical examples for more clarity.
Data analytics is a powerful tool that helps organizations make informed decisions by analyzing data and deriving valuable insights. Process is not a single-step task but a structured journey consisting of several phases. Each phase in the life cycle plays a critical role in converting raw data into actionable knowledge.

Data Analytics Life Cycle Process
Data Analytics Life Cycle refers to a structured sequence of steps that guide the process of analyzing data, extracting meaningful insights, and making data-driven decisions. Each phase in this cycle ensures that data is systematically collected, cleaned, explored, modeled, validated, and deployed to solve business problems effectively.
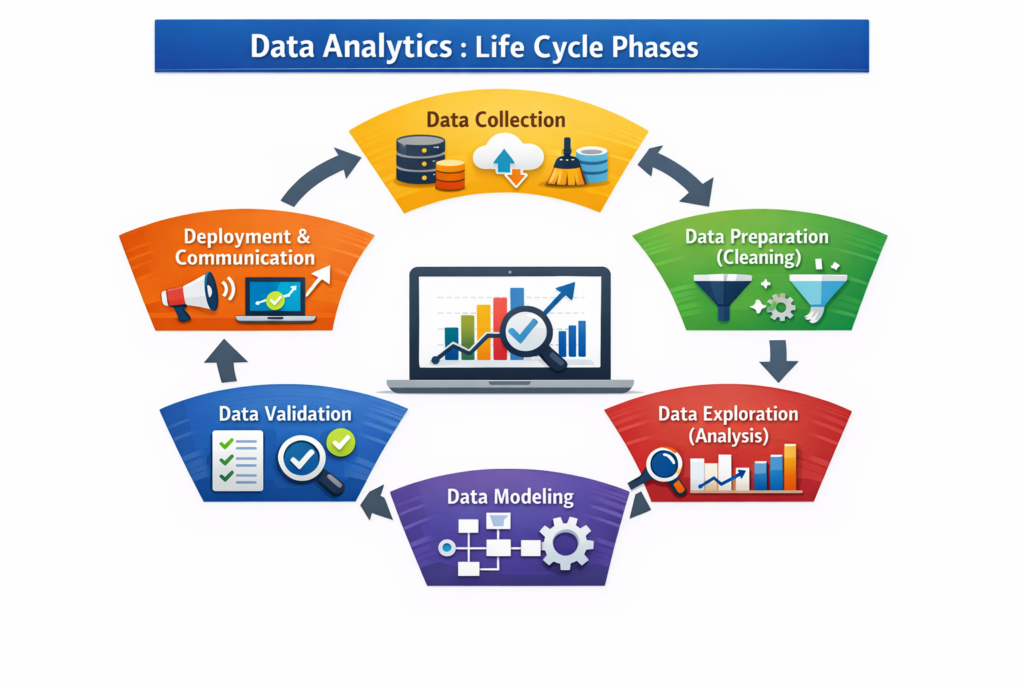
The key phases of the Data Analytics Life Cycle Process include:
- Data Collection
- Data Preparation (Cleaning)
- Data Exploration (Analysis)
- Data Modeling
- Data Validation
- Deployment and Communication
1. Data Collection
Data collection is the first and most critical phase of the data analytics life cycle. It involves gathering relevant data from a variety of sources such as databases, surveys, APIs, social media platforms, or external providers.
- The quality and comprehensiveness of the collected data directly impact the effectiveness of the analysis.
- The goal is to ensure that the data is complete, accurate, and relevant to the problem being analyzed.
Online transactions from their e-commerce platform.
In-store purchases recorded through point-of-sale systems.
Customer feedback forms collected through surveys.
This raw data forms the foundation for the analysis, helping the company understand customer preferences, seasonal trends, and buying behavior.
2. Data Preparation
Data preparation, also known as data cleaning or preprocessing, involves transforming the collected data into a clean and structured format.
- This phase includes handling missing values, correcting errors, removing duplicates, and converting data into a consistent format.
- A well-prepared dataset ensures that subsequent analysis is accurate and reliable.
Fill in missing information, such as addresses or contact details.
Remove duplicate records where customers may have applied multiple times.
Standardize formats, such as dates and currency values, to ensure consistency.
By cleaning the data, the bank ensures that its analysis reflects true patterns and insights.
3. Data Exploration
Data exploration is a critical phase where analysts dive deep into the data to uncover patterns, relationships, and anomalies.
- This phase often involves visualizing the data through charts, graphs, and summary statistics to gain an initial understanding.
- It helps in identifying trends and outliers that might impact the analysis.
Trends in disease outbreaks across different regions.
Seasonal patterns in illnesses, such as flu cases peaking in winter.
Anomalies in patient data that might indicate errors or unique cases.
Visualizing this data helps healthcare professionals prepare for upcoming trends and allocate resources effectively.

4. Data Modeling
In this phase, analysts apply statistical models and machine learning algorithms to the prepared data. Data modeling aims to identify relationships between variables and make predictions or classifications.
- The choice of model depends on the problem being solved – whether it’s forecasting, clustering, or classification.
Monthly or seasonal sales trends.
Customer preferences for certain product categories.
The potential success of future marketing campaigns.
These insights help the company optimize inventory and marketing strategies.
5. Data Validation
Data validation ensures that the models and insights generated are accurate, reliable, and aligned with real-world outcomes.
- This phase involves comparing the model’s predictions with actual results and fine-tuning the model if necessary.
- Validation helps in building trust and confidence in the analytical outcomes.
Predicted churn rates with actual customer retention data over a specific period.
Adjustments are made to improve the model’s accuracy if discrepancies are found.
Accurate validation ensures that the company can implement effective retention strategies based on reliable predictions.
6. Deployment and Communication
The final phase involves sharing insights with stakeholders in a clear, actionable format. This could include dashboards, reports, or presentations presented to the audience.
- If a model is developed, it may also be deployed into real-time systems for ongoing use.
- Effective communication ensures that insights drive decision-making.
Integrating the model into a mobile app used by drivers.
Creating dashboards for fleet managers to monitor performance.
Presenting insights in reports to show cost savings and efficiency improvements.
By effectively communicating and deploying these insights, the company enhances its operations and achieves significant cost savings.
- Provides a structured approach to data analysis
- Improves decision making capabilities
- Helps identify trends and patterns
- Increases business efficiency
- Supports data driven strategies
- Provides a structured approach to data analysis
- Improves decision making capabilities
- Helps identify trends and patterns
- Increases business efficiency
- Supports data driven strategies
Final Thoughts
Life cycle phases of data analytics help break down the process of turning raw data into useful insights. Each step, from collecting data to using the results, plays an important role in making sure the analysis is accurate and useful. By understanding and following these steps, businesses can make better decisions and achieve success.
If you want to build a career in data analytics, join a course at Prime Max Academy today and start your journey toward exciting job opportunities!

Frequently Asked Questions
Answer:
The Data Analytics Life Cycle is a step-by-step process that guides how data is collected, cleaned, analyzed, and used to make business decisions. The Data Analytics Life Cycle helps organizations convert raw data into meaningful insights through a structured data analytics process.
Answer:
The six major stages of the Data Analytics Life Cycle are Data Collection, Data Preparation, Data Exploration, Data Modeling, Data Validation, and Deployment. These stages form the complete data analytics workflow and ensure accurate data analysis results.
Answer:
The first phase of the Data Analytics Life Cycle is Data Collection. In this stage, data is gathered from different sources like databases, websites, APIs, and business systems. Proper data collection is important because the quality of the Data Analytics Life Cycle depends on the quality of the collected data.
Answer:
The Data Analytics Life Cycle is important because it provides a structured approach to solving problems using data. It improves data quality, helps in better decision-making, and ensures that the data analytics process is systematic and reliable.
Answer:
In the Data Preparation stage of the Data Analytics Life Cycle, raw data is cleaned and transformed. This step includes removing duplicates, handling missing values, and formatting data properly. Data preparation is one of the most important phases because clean data leads to better analytics outcomes.
Answer:
The Data Analytics Life Cycle ends with deployment and communication. In this final stage, insights are shared through reports, dashboards, or visualizations. This stage of the Data Analytics Life Cycle ensures that stakeholders can understand the results and take action based on data insights.

