
Why Time Series Analysis Is Still Underrated
Why Time Series Analysis Is Still Underrated
In a world obsessed with machine learning models, real-time dashboards, and generative AI, one of the oldest and most practical branches of analytics quietly keeps getting overlooked: time series analysis. Despite powering everything from demand forecasting to financial risk models, it rarely gets the attention that flashier techniques receive. This article explores why time series analysis remains one of the most underrated skills in data analytics, how it works, and why every analyst should take it seriously.

What Time Series Analysis Actually Is
Time series analysis is the study of data points collected or recorded at successive points in time, such as daily sales, monthly website traffic, hourly server load, or quarterly revenue. Unlike standard datasets where order does not matter, time is the defining structure of this data. Patterns like trend, seasonality, and cyclical behavior only reveal themselves when data is examined in its proper time sequence.
This makes time series analysis fundamentally different from a simple average or a one-time snapshot. It is built specifically to answer questions like: is this metric truly growing, or is this just a seasonal spike? How much of this month’s dip is normal fluctuation versus an actual problem? What will next quarter likely look like if current patterns continue?
Why It Gets Overlooked
Several reasons explain why time series methods do not get the spotlight that newer machine learning techniques enjoy.
- It is often seen as an ‘old’ statistical technique compared to newer AI-driven approaches
- Many analysts only learn it briefly in academic settings and rarely apply it in daily reporting
- Business dashboards often show simple period-over-period comparisons instead of proper time-aware analysis
- It requires understanding concepts like seasonality and autocorrelation, which take more effort than reading a bar chart
- Modern buzzwords like predictive analytics and AI forecasting sometimes overshadow the classical techniques that still power many of these systems under the hood
Core Components of Time Series Analysis
To use time series analysis effectively, it helps to understand the components that make up nearly every time-based dataset.
Trend
The long-term direction of the data, whether it is generally increasing, decreasing, or staying flat over an extended period, separate from short-term noise.
Seasonality
Regular, predictable patterns that repeat over a fixed period, such as higher retail sales every December or increased website traffic every weekday morning.
Cyclical Patterns
Longer, less predictable fluctuations often tied to broader economic or industry cycles, distinct from the fixed regularity of seasonality.
Noise
Random variation that cannot be explained by trend, seasonality, or cycles, and should not be mistaken for a meaningful signal.
Recognizing these four components is the foundation of every serious time series analysis project, whether it is done with simple spreadsheet formulas or advanced forecasting software.
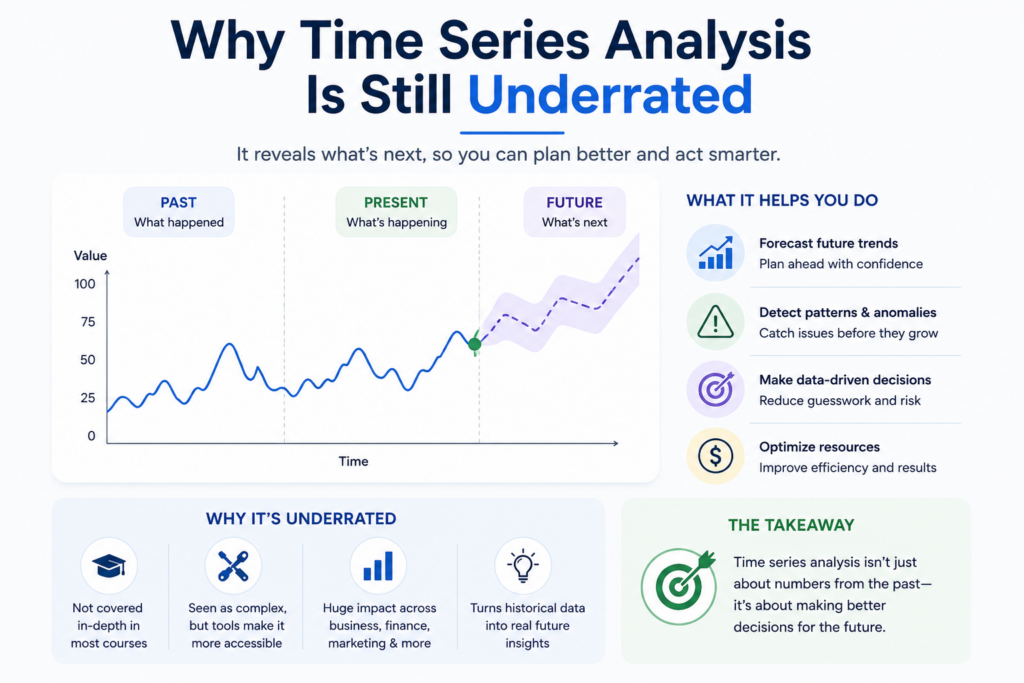


Why Time Series Analysis Matters for Business Decisions
Ignoring the time dimension of data leads to some of the most common and costly business mistakes. A sales spike during a holiday season can be mistaken for genuine growth, leading to over-investment in inventory or staffing that is not sustainable the rest of the year. A dip in customer sign-ups every August might simply reflect a predictable seasonal lull rather than a failing marketing strategy.
Proper time series analysis prevents these misinterpretations by separating what is a normal, expected pattern from what is a genuine shift that deserves attention. This distinction alone can save a company from reacting to noise instead of addressing a real problem, or from missing a real problem because it was masked by a temporary seasonal boost.
Common Applications Across Industries
Time series analysis is far more widespread in everyday business operations than most people realize. Common uses include:
- Retail demand forecasting to plan inventory levels ahead of seasonal peaks
- Financial markets analysis, including stock price trends and volatility patterns
- Website and app analytics to distinguish real growth from seasonal or weekly traffic patterns
- Energy consumption forecasting to plan supply against predictable daily and seasonal demand cycles
- Healthcare monitoring, such as tracking patient vitals or disease outbreak patterns over time
- Workforce planning, forecasting staffing needs based on historical demand cycles
Popular Techniques Within Time Series Analysis
While the field can get mathematically deep, a few foundational techniques cover the majority of practical use cases.
- Moving averages: smoothing out short-term fluctuations to reveal the underlying trend more clearly.
- Seasonal decomposition: splitting a series into trend, seasonal, and residual components for clearer analysis.
- Autocorrelation analysis: measuring how much a data point is related to previous points in the same series.
- Exponential smoothing models: giving more weight to recent observations when forecasting future values.
- ARIMA models: a widely used statistical approach for both understanding patterns and generating forecasts.
- Machine learning based forecasting: newer approaches that can capture more complex, nonlinear patterns in large time-based datasets.
How to Start Applying Time Series Analysis Yourself
You do not need advanced statistical software to begin benefiting from time series thinking. Consider these practical starting points:
- Always plot your data over time before drawing conclusions from a single number or average
- Compare current performance against the same period last year, not just the previous period, to account for seasonality
- Calculate a simple moving average to separate genuine trend from short-term noise
- Flag repeating patterns you notice, such as weekly dips or monthly spikes, and document them for future reference
- When forecasting, start with simple models before jumping to complex machine learning approaches
The Future of Time Series Analysis
Rather than being replaced by newer AI techniques, time series analysis is increasingly being combined with them. Modern forecasting systems often blend classical statistical methods with machine learning models to capture both well-understood seasonal patterns and more complex, hidden relationships in the data. This means the foundational knowledge of time series analysis remains just as relevant as ever, since understanding these fundamentals helps analysts interpret and trust the output of more advanced automated forecasting tools.
As more business decisions rely on forecasts, whether for inventory, staffing, budgeting, or risk management, the ability to properly analyze data over time will only grow in importance, even as the underlying tools continue to evolve.
Common Mistakes When Working With Time-Based Data
Even experienced analysts can misapply time series concepts if they are not careful. A few mistakes appear repeatedly across industries and skill levels.
- Comparing this month to last month without accounting for seasonal effects, leading to false alarms or false confidence
- Using too short a historical window to judge a trend, mistaking normal short-term noise for a real pattern
- Ignoring outliers caused by one-time events, such as a system outage or a marketing promotion, which can distort seasonal patterns
- Assuming a forecasting model will remain accurate indefinitely without retraining it as new data comes in
- Overfitting a model to historical quirks that are unlikely to repeat in the future
Avoiding these pitfalls requires patience and a willingness to question initial results rather than accepting the first output a tool or model produces.
How Time Series Analysis Complements Other Analytics Techniques
Time series analysis rarely works in isolation. It is most powerful when combined with other analytical approaches, such as segmentation or cohort analysis, to explain not just what is happening over time, but for which specific group of customers or products. For example, an overall revenue trend might look stable, while time series analysis broken down by customer segment reveals that one segment is growing rapidly while another is quietly declining, a detail a single aggregate trend line would hide.
Pairing time series methods with root-cause analysis also strengthens decision-making. Once a genuine trend or seasonal deviation is identified, further investigation into underlying causes, such as pricing changes, competitor activity, or shifts in customer behavior, turns a statistical observation into a fully actionable business insight.
Building Confidence in Forecasts
One of the most valuable, and most often skipped, steps in time series analysis is measuring how accurate past forecasts actually were. Many teams generate a forecast, move on to the next project, and never circle back to check whether the prediction matched reality. Building a habit of comparing forecasted values against actual outcomes helps teams understand how much to trust future forecasts and identify when a model needs adjustment.
- Track forecast accuracy consistently using a simple error metric over time
- Review forecasts on a regular schedule, not only when results look surprising
- Adjust models when new patterns emerge instead of assuming past accuracy will continue automatically
- Communicate a confidence range alongside any forecast, rather than presenting a single fixed number as certain
Getting Started Without Heavy Software
A common misconception is that time series analysis requires specialized statistical software or advanced programming knowledge. In reality, many valuable insights can be uncovered using tools most analysts already have access to, such as spreadsheet software with built-in trendlines and moving average functions. Plotting a metric weekly for a full year, adding a simple moving average line, and visually comparing the current period against the same period a year earlier is often enough to catch major seasonal effects or genuine trend shifts.
As comfort with these basics grows, analysts can gradually move toward dedicated forecasting libraries or statistical software for more precise modeling. Starting simple, however, builds the intuition needed to later interpret more advanced, automated forecasting output critically instead of accepting it blindly.
Who Should Prioritize Learning Time Series Analysis
While every analyst benefits from understanding these concepts, certain roles gain outsized value from mastering time series analysis specifically. Financial analysts use it constantly to interpret revenue and expense trends. Marketing analysts rely on it to separate genuine campaign impact from natural seasonal traffic patterns. Supply chain and operations professionals depend on accurate forecasting to avoid both stockouts and excess inventory. Even product managers benefit, since understanding usage trends over time helps distinguish a temporary dip from a genuine sign that a feature is losing relevance.
Regardless of job title, anyone who regularly reports on metrics that change week to week or month to month will find that a working knowledge of time series analysis makes their reporting more accurate and far more credible to the stakeholders who rely on it.
Conclusion
Time series analysis may not carry the same buzz as artificial intelligence or generative models, but it remains one of the most practically valuable skills an analyst can develop. It prevents costly misinterpretations, powers accurate forecasting, and forms the backbone of decisions across retail, finance, healthcare, and technology.
Analysts who invest in mastering trend, seasonality, and forecasting fundamentals will continue to bring outsized value to their organizations, long after the latest analytics trend has faded. Whatever new tools or models emerge next, the fundamental skill of reading patterns over time will remain a core part of good analytical work.
Frequently Asked Questions
Answer:
Python is widely used for predictive analytics because it offers powerful libraries like Pandas, NumPy, and Scikit-learn that simplify data processing and machine learning. Its simple syntax also makes it easier for beginners and professionals to analyze large datasets efficiently. Businesses prefer Python because it supports automation, accuracy, and faster model development.
Answer:
Python helps in data reporting by automating report generation and creating visual dashboards using libraries like Matplotlib and Seaborn. Analysts can easily transform raw data into charts, graphs, and summaries that improve understanding. This saves time and helps organizations make data-driven decisions more effectively.
Answer:
Many industries use Python data analysis, including healthcare, finance, retail, marketing, and e-commerce. Companies use it to predict customer behavior, detect fraud, forecast sales, and improve operational efficiency. Its flexibility makes it suitable for almost every data-driven industry.
Answer:
Yes, Python is considered one of the best programming languages for beginners in data analytics. It has a simple and readable syntax, along with a large community and learning resources. Beginners can quickly learn data cleaning, visualization, and predictive analytics using Python tools and libraries.
Answer:
Python improves predictive analytics and reporting by providing faster data processing, automation, and accurate forecasting capabilities. It helps businesses identify trends, generate reports, and visualize data more clearly. These features support better decision-making and overall business growth.

