
How Small Businesses Can Use Data Analytics
How Small Businesses Can Use Data Analytics Without a Dedicated Data Team
Running a small business often means wearing five different hats before lunch. Hiring a full data team, with dedicated analysts, engineers, and a BI specialist, simply isn’t realistic for most small budgets. But here’s the good news: you don’t need any of that to start benefiting from data analytics.
Data analytics has become far more accessible in recent years. Tools that once required technical staff to operate are now built for everyday business owners, with drag-and-drop dashboards, plain English queries, and automated reporting. The real question isn’t whether a small business can use data analytics it’s how to do it efficiently with limited time, budget, and staff.

Step 1: Start With the Questions, Not the Data
A common mistake small business owners make is collecting data first and figuring out what to do with it later. Flip that order. Before opening any tool, write down the three or four questions that actually matter to your business right now, such as:
- Which products or services bring in the most profit, not just the most sales?
- Where are most of my customers coming from?
- What time of day or week do I get the most orders or bookings?
- Which marketing channel actually drives paying customers, not just clicks?
Once you know the questions, data analytics becomes a tool for answering them not an overwhelming pile of numbers with no clear purpose.
Step 2: Use the Data You Already Have
Most small businesses already sit on more data than they realize. You don’t need to build new systems to start a data analytics practice you need to look at what’s already being collected.
Common sources include:
| Source | What It Tells You |
|---|---|
| POS or e-commerce system | Sales trends, best-selling items, peak hours |
| Website analytics | Visitor behavior, traffic sources, bounce rate |
| Social media insights | Audience engagement, best-performing content |
| Email marketing platform | Open rates, click rates, customer interest |
| Accounting software | Cash flow patterns, expense trends |
Pulling these together, even manually at first, gives you a surprisingly complete picture without spending a single extra dollar.


Step 3: Pick Tools Built for Non-Technical Users
This is where small businesses have an advantage they didn’t have a decade ago. Modern data analytics tools are designed with simplicity in mind. A few categories worth knowing:
1. Built-in platform analytics
Most POS systems, e-commerce platforms (like Shopify or Square), and social media tools already include analytics dashboards. These require zero setup and are often the best starting point.
2. No-code dashboard tools
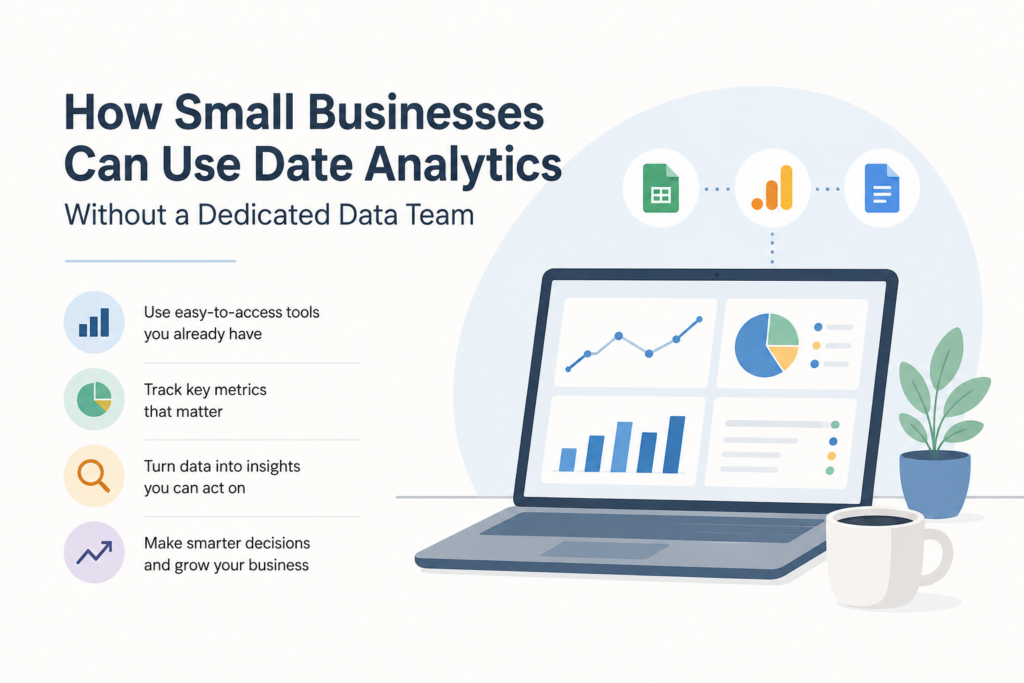
Platforms like Google Looker Studio (free) or Microsoft Power BI’s simpler tiers let you connect multiple data sources and build visual reports without writing code.
3. AI-powered query tools
A growing number of data analytics tools now let you type a plain question “What were my top 5 products last month?” and get an instant chart or answer back.
4. Spreadsheet-based analytics
Don’t underestimate a well-organized spreadsheet. Tools like Google Sheets or Excel, combined with pivot tables and basic formulas, can handle a surprising amount of small business data analytics needs.
The goal isn’t to use the most advanced tool it’s to use the simplest one that answers your questions reliably.
Step 4: Build a Light, Repeatable Routine
Data analytics only delivers value if it’s reviewed consistently, not just once. Small businesses don’t need a daily deep dive a lightweight, repeatable routine works better and is far easier to maintain.
A simple structure to follow:
- Weekly (15–20 minutes): Check sales trends, top products, and website or social traffic
- Monthly (30–45 minutes): Review marketing channel performance, customer retention, and cash flow patterns
- Quarterly (1–2 hours): Step back and look at bigger trends seasonal shifts, customer lifetime value, and overall growth direction
Keeping this routine short and scheduled makes it far more likely to actually happen, compared to vague plans to “look at the numbers sometime.”
Step 5: Know When to Bring in Outside Help
Not having a dedicated data team doesn’t mean going it completely alone. There are a few situations where a small amount of outside expertise pays off:
- Initial dashboard setup A freelance analyst can help build your first dashboard correctly, saving hours of trial and error later
- Data integration issues If your tools don’t talk to each other well, a short consulting engagement can solve this once
- Advanced forecasting needs If you’re ready for predictive data analytics (like demand forecasting), a specialist can set up the model even if you maintain it yourself afterward
This approach paying for short, targeted expertise rather than a full-time hire lets small businesses access advanced data analytics capability without the ongoing overhead.
Common Pitfalls to Avoid
Small businesses new to data analytics tend to run into a few avoidable traps:
- Tracking too much, too soon. Trying to monitor 20 metrics at once usually leads to monitoring none of them well. Start with three to five that matter most.
- Ignoring data quality. Inconsistent naming, duplicate entries, or missing fields in your POS or CRM will quietly distort every report built on top of them.
- Treating reports as decoration. A dashboard that’s never acted on isn’t data analytics it’s wallpaper. Every report should tie back to a decision.
- Skipping context. A spike in sales means little without knowing why it happened (a promotion, a holiday, a viral post). Always pair numbers with notes on what was happening at the time.
Turning Data Analytics Into Everyday Decisions
Data sitting in a dashboard has no value until it changes a decision. Small business owners get the most out of data analytics when they build a habit of connecting numbers directly to action. A few practical examples:
- If website analytics shows most visitors leave on the pricing page, test simplifying that page or adding a clearer call-to-action.
- If sales data shows a particular product consistently underperforms, consider whether to discount it, bundle it, or phase it out.
- If email open rates are highest on a specific day, shift your sending schedule to match that pattern.
- If customer data shows repeat buyers spend more on a second purchase within 30 days, build a simple follow-up offer targeting that window.
None of these require advanced statistics they require noticing a pattern in the data and testing a small change in response. That loop, repeated consistently, is the real core of data analytics for a small business.
Final Thoughts
The biggest myth around data analytics is that it requires a big team, a big budget, or a big tech stack. In reality, small businesses can build a genuinely effective data analytics habit using free or low-cost tools, a short weekly routine, and a clear focus on the handful of questions that actually drive decisions.
Start small. Pick the data you already have, ask better questions of it, and build the habit of checking it on a fixed schedule. As your business grows, your data analytics needs can grow with it but you never need a dedicated team to start getting real value from the data sitting right in front of you.
Frequently Asked Questions
Answer:
Yes, absolutely. Most small businesses already generate enough data through their POS system, website, and social media accounts to start spotting useful patterns. With free or low-cost tools and a consistent weekly review habit, an owner can extract meaningful insights without ever hiring a dedicated analyst.
Answer:
The easiest starting point is using the analytics dashboards already built into tools you’re using, like your e-commerce platform, social media accounts, or accounting software. Before opening any tool, write down two or three specific business questions you want answered. This keeps the process focused instead of overwhelming.
Answer:
In many cases, a small business can get started for free using built-in platform analytics and tools like Google Looker Studio. If more advanced reporting is needed, paid add-ons typically run $20–$50 a month, with occasional one-time freelance help costing a few hundred dollars for initial setup.
Answer:
Outside help is most useful for one-time tasks like setting up your first dashboard correctly, fixing issues where your tools don’t share data well, or building a predictive model for demand forecasting. These short, targeted engagements are usually more cost-effective than hiring a full-time data analyst.
Answer:
The most common mistake is tracking too many metrics at once or reviewing data without ever acting on it. A dashboard that isn’t tied to actual decisions provides little real value, so it’s far more effective to focus on three to five key metrics and build them into a regular decision-making routine.

