
Feature Selection Techniques in Data Science
Feature Selection Techniques in Data Science
There’s a strange irony in modern data work. We collect more variables than ever hundreds, sometimes thousands of columns sitting in a single dataset yet most of that information ends up being noise rather than signal. The real skill isn’t gathering more data; it’s figuring out which pieces of it actually matter.
This is where feature selection techniques come into the picture, and they’re far more important than most beginners give them credit for.

Why throwing everything at a model doesn’t work
It feels intuitive to assume that more variables mean more accuracy. A model with 200 features should outperform one with 20, right? Not necessarily, and often not at all.
When irrelevant or redundant variables get fed into a model, a few bad things tend to happen:
- The model starts learning patterns that don’t generalize, a problem commonly known as overfitting
- Training time increases significantly, sometimes for no performance gain at all
- Interpretability collapses try explaining a decision driven by 150 variables to a non-technical stakeholder
- Multicollinearity creeps in, where correlated variables distort coefficient estimates in linear models
So instead of asking “how much data can I include,” the better question becomes “which variables are actually pulling weight” and that question is exactly what feature selection sets out to answer.
The three broad families worth knowing
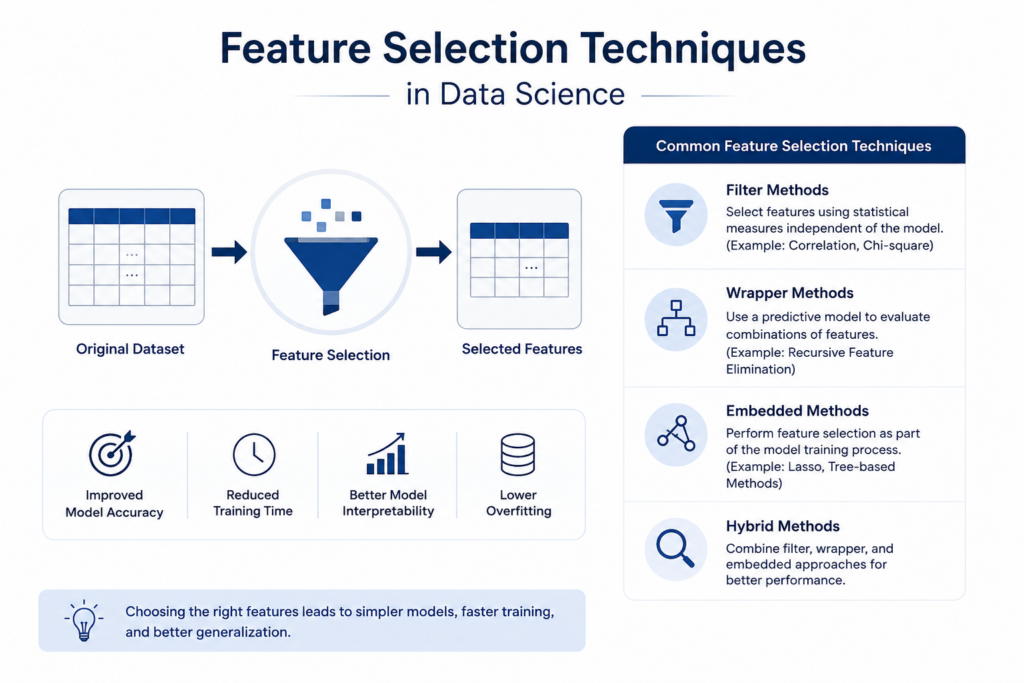
Most approaches to picking the right variables fall into three categories, and understanding the difference helps a lot when deciding which to use.
Filter methods look at each variable in isolation, evaluating its statistical relationship with the target, without involving any machine learning model at all. Think correlation coefficients, chi-square tests, or mutual information scores. They’re fast and cheap, which makes them a good first pass on large datasets, but they miss interactions between variables.
Wrapper methods, on the other hand, actually train a model repeatedly with different subsets of variables and measure performance directly. Recursive Feature Elimination (RFE) is the classic example here it trains a model, removes the weakest variable, retrains, and repeats until only the strongest set remains. This tends to give better results than filter methods but at a real computational cost, since you’re essentially running dozens or hundreds of training cycles.
Embedded methods sit somewhere in between. These build the selection process directly into model training. Lasso regression (L1 regularization) is a textbook example it naturally pushes the coefficients of weak variables toward zero, effectively removing them during training rather than as a separate step. Tree-based models like Random Forest and XGBoost also offer built-in importance scores that double as a form of embedded selection.
A closer, practical breakdown
- Correlation thresholding — drop one of two variables if they’re correlated above a chosen cutoff, usually around 0.8 or 0.9
- Chi-square test — useful specifically for categorical variables against a categorical target
- ANOVA F-test — compares means across groups, helpful when the target is categorical but the input is continuous
- Recursive Feature Elimination — iteratively removes the least useful variables based on model coefficients or importance
- Lasso (L1) regularization — shrinks weak coefficients to exactly zero, built directly into the model
- Tree-based importance scores — uses how often and how effectively a variable splits decision nodes
- Principal Component Analysis — technically a transformation rather than a selection method, but often used for a similar goal of reducing dimensionality
- Boruta — a wrapper method built around random forests that compares real variables against randomized “shadow” versions to test statistical significance
None of these is universally “best” for feature selection. A dataset with a few hundred rows and a hundred columns behaves very differently than one with millions of rows and twenty columns, and the right method depends heavily on that context.
A real scenario to make this concrete
Picture a telecom company trying to predict which customers are likely to cancel their subscription. The raw dataset includes call logs, billing history, customer service tickets, demographic info, and app usage stats easily 150+ columns once everything is merged.
A data scientist working on this wouldn’t just throw all 150 columns into a gradient boosting model and call it done, even though the model might technically handle it. Instead, the process would likely go something like:
- Start with a correlation matrix to spot and remove obviously redundant variables (say, “total minutes used” and “average daily minutes” measuring nearly the same thing)
- Run a quick filter method to rank variables by their individual relationship with churn
- Train a baseline model using the top candidates and check feature importance scores
- Use those importance scores to prune further, removing variables contributing almost nothing
- Validate that the smaller feature set doesn’t hurt performance on a holdout set, and very often, it actually improves it
What usually emerges from this process is a leaner model maybe 20 to 30 variables instead of 150 that’s faster to train, easier to explain to the retention team, and just as accurate, sometimes more so.


Mistakes that trip people up
A few patterns show up again and again among less experienced practitioners:
- Selecting variables based on the entire dataset before splitting into train and test, which leaks information and inflates performance estimates
- Assuming that statistical significance automatically means practical importance a variable can be statistically significant with a tiny, meaningless effect size
- Removing variables purely because they have low correlation with the target while ignoring interaction effects that only matter in combination with other variables
- Treating selection as a one-time task instead of revisiting it as the underlying data or business context shifts over time
That last point deserves emphasis. A variable that mattered a year ago might be dead weight today simply because customer behavior changed, or because a business process generating that data was discontinued.
How this connects to the bigger picture
Picking the right variables doesn’t happen in isolation. It’s tightly linked to the exploratory work that comes before it and the model evaluation that comes after, which is why feature selection is best treated as part of a loop rather than a single linear step. A variable that looked promising during early data exploration might not survive a rigorous wrapper method, and that’s fine this is meant to be an iterative loop, not a single linear step.
There’s also a growing trend toward combining automated and manual judgment. Automated pipelines can run dozens of statistical tests in minutes, something no human could match by hand. But a domain expert who understands why a customer service ticket count might be a leading indicator of cancellation something a purely statistical test might underweight still adds something automation alone can’t replicate.
A short note on dimensionality and modern data
As datasets grow wider rather than just longer more sensors, more tracked behaviors, more third-party enrichment data the temptation to keep everything “just in case” grows too. Storage is cheap, after all. But model performance, interpretability, and maintainability are not free, and bloated feature sets quietly tax all three.
A leaner, well-justified set of inputs tends to age better as well. When a model needs to be retrained six months later, debugging twenty well-understood variables is a vastly different experience than untangling two hundred poorly understood ones.
Stability and reproducibility concerns
One thing that doesn’t get discussed enough is how stable a chosen set of variables actually is across different samples of the same data. If you run a wrapper method on one random split of your dataset and get one set of “important” variables, then run it again on a slightly different split and get a noticeably different set, that’s a red flag worth taking seriously.
This kind of instability often shows up when:
- The dataset is small relative to the number of candidate inputs, making any single split sensitive to random noise
- Several variables are highly correlated with each other, so the model can pick any one of them somewhat arbitrarily to represent the same underlying signal
- The target variable itself is noisy or inconsistently labeled, which makes any downstream ranking shaky by extension
A reasonable safeguard is to run the selection process across multiple random splits or through cross-validation, then look at which variables consistently show up as important rather than trusting a single run. Variables that appear reliably important across many different samples deserve far more confidence than ones that only showed up once.
Balancing automation with domain judgment
There’s a quiet tension in this part of the workflow between trusting the numbers and trusting human expertise. Purely statistical approaches are blind to business meaning they don’t know that a particular variable represents a regulatory requirement that must be tracked regardless of its statistical contribution, or that another variable is a leading indicator specifically because of how a sales team operates, not because of any pattern visible in historical data alone.
A few questions worth asking before finalizing any reduced variable set:
- Does removing this variable eliminate something the business legally or operationally needs to track?
- Would a domain expert be surprised that this variable was dropped, and if so, why?
- Is there a seasonal or rare-event variable that looks unimportant most of the time but becomes critical during specific periods (holiday demand spikes, economic downturns)?
- Does the simplified model still make intuitive sense when explained out loud to someone outside the data team?
Answering these honestly often prevents a technically optimized but practically blind model from making it into production.
When less data actually beats more
It’s worth sitting with a counterintuitive idea: a smaller, well-chosen set of inputs can genuinely outperform a larger one, not just match it. This happens because every additional weak variable adds a small amount of noise, and noise compounds. A model trying to learn from 200 variables, many of them barely relevant, has to work harder to separate genuine signal from statistical static, and that extra difficulty often shows up as worse performance on new, unseen data rather than better.
There’s also a practical, organizational angle to this that rarely makes it into textbooks. A model with 25 well-understood variables can be explained in a single meeting to a skeptical stakeholder. A model with 200 variables, half of which nobody on the team can confidently describe six months after the original build, becomes a liability the moment something goes wrong and someone needs to figure out why.
Wrapping it together
There’s no universal formula here, and that’s actually the honest answer most practitioners would give if pressed. What works depends on the size of the dataset, the type of model being used, how much compute is available, and how much interpretability matters for the end audience. What stays constant is the underlying principle: more isn’t automatically better, and a model built on carefully chosen inputs will almost always outperform, and certainly outlast, one built on everything thrown at the wall at once.
Frequently Asked Questions
Answer:
Including every variable often introduces noise, redundancy, and irrelevant information that can hurt a model’s ability to generalize to new data. It also increases training time, reduces interpretability, and can introduce multicollinearity issues in certain model types. A carefully chosen smaller set of variables frequently performs just as well, or better, while remaining far easier to explain and maintain.
Answer:
Filter methods evaluate each variable’s relationship with the target independently of any model, making them fast but limited in capturing interactions. Wrapper methods actually train and evaluate models repeatedly with different variable subsets, offering better accuracy at a higher computational cost. Embedded methods build the selection process directly into model training itself, such as Lasso regression shrinking weak coefficients to zero automatically.
Answer:
Correlation analysis and basic filter methods are a sensible starting point because they’re simple to understand and quick to apply. From there, trying tree-based feature importance scores from models like Random Forest offers a more model-aware perspective without the heavy computation of full wrapper methods. As comfort grows, exploring Recursive Feature Elimination or Lasso regularization adds more rigor to the process.
Answer:
Not always, but it very often improves generalization, training speed, and interpretability even when raw accuracy stays similar. In some cases, removing too many variables too aggressively can actually hurt performance if useful information gets discarded along with the noise. The key is validating any reduced feature set against a holdout dataset rather than assuming fewer variables is automatically better.
Answer:
It shouldn’t be treated as a one-time task completed at the start of a project. As underlying data, customer behavior, or business processes shift over time, previously useful variables can lose relevance while new ones become important. Revisiting this process periodically, especially after major data or business changes, keeps a model aligned with current reality.

