
Excel vs Google Sheets for Data Analytics
Excel vs Google Sheets for Data Analyst
Excel vs Google Sheets for Data Analytics is a common comparison for students, aspiring Data Analysts, and professionals looking to build analytical skills. Both tools are widely used to organize data, perform calculations, create reports, and visualize insights. However, they differ in terms of features, performance, collaboration, and business use cases.
Microsoft Excel has been the industry standard for decades and is known for its advanced analytical capabilities. Google Sheets, on the other hand, has become increasingly popular because of its cloud based collaboration and ease of sharing.

Why Spreadsheet Skills Matter in Data Analytics
Before data reaches advanced tools like SQL, Power BI, Tableau, or Python, it often starts in a spreadsheet.
Data Analysts use spreadsheets to:
- Clean raw data
- Perform calculations
- Analyze trends
- Create reports
- Build dashboards
- Validate information
- Share insights with stakeholders
Whether you choose Excel or Google Sheets, learning spreadsheet fundamentals is an important step in becoming a Data Analyst.
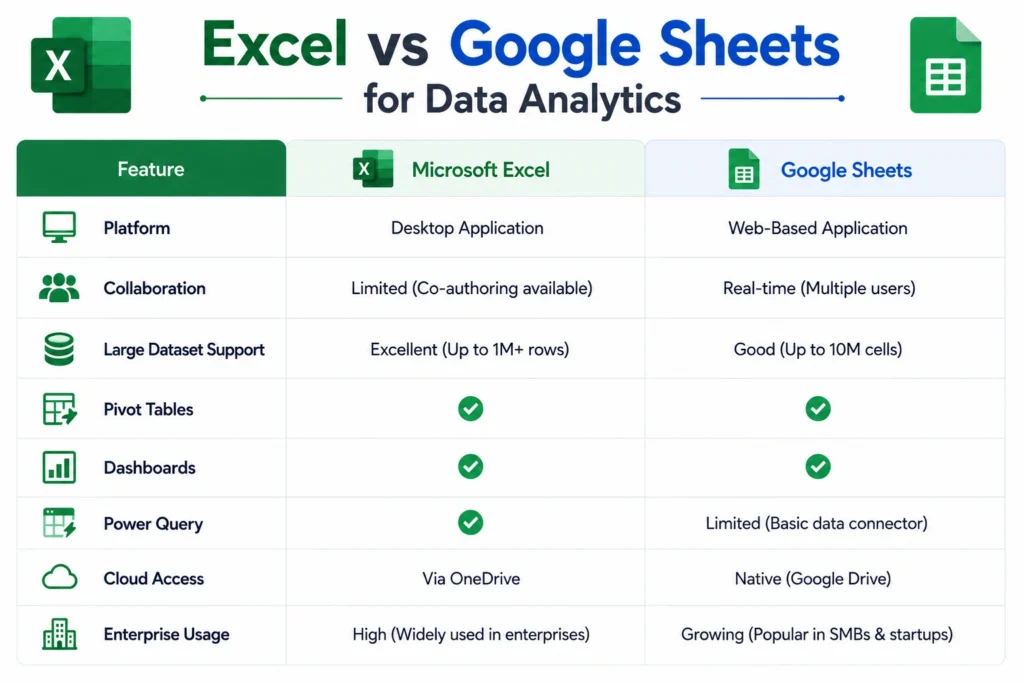
Excel vs Google Sheets, Feature Comparison
| Feature | Microsoft Excel | Google Sheets |
|---|---|---|
| Platform | Desktop & Cloud | Cloud based |
| Collaboration | Good | Excellent |
| Large Dataset Handling | Excellent | Good |
| Advanced Formulas | Excellent | Very Good |
| Pivot Tables | Advanced | Good |
| Charts & Dashboards | Advanced | Good |
| Power Query | Yes | No |
| Offline Access | Excellent | Limited |
| Google Workspace Integration | Limited | Excellent |
| Enterprise Adoption | Very High | High |
Both tools are capable of handling everyday analytics tasks, but Excel offers more advanced functionality, while Google Sheets excels in collaboration.
Microsoft Excel: Strengths for Data Analytics
Excel is widely used in finance, consulting, manufacturing, banking, and large enterprises.
Its strengths include:
- Advanced formulas and functions
- Power Query for data transformation
- Pivot Tables and Pivot Charts
- Powerful dashboard creation
- Better performance with large datasets
- Advanced data analysis tools
- Strong integration with Microsoft Power BI
Because of these capabilities, Excel remains one of the most requested skills in Data Analyst job descriptions.
Google Sheets: Strengths for Data Analytics
Google Sheets is especially popular among startups, marketing agencies, educational institutions, and remote teams.
Its biggest advantages are:
- Real time collaboration
- Automatic cloud saving
- Easy sharing through Google Drive
- Built in version history
- Seamless integration with Google Workspace
- Access from any device
If multiple people need to work on the same report simultaneously, Google Sheets is often the better choice.
Which Tool Is Better for Data Cleaning?
Data cleaning is one of the most important tasks in Data Analytics.
Both tools allow you to:
- Remove duplicates
- Filter records
- Sort data
- Handle missing values
- Standardize formats
However, Excel provides an advantage through Power Query, which automates repetitive data preparation tasks and is particularly useful for working with larger datasets.
For beginners and smaller datasets, Google Sheets offers enough functionality to perform most cleaning tasks effectively.
Which Tool Creates Better Dashboards?
Both Excel and Google Sheets can be used to build dashboards, but Excel provides more customization and advanced visualization features.
Excel supports:
- Interactive dashboards
- Slicers
- Timeline filters
- Advanced charts
- Better formatting options
Google Sheets is ideal for simple dashboards that need to be shared quickly with teams online.
If your goal is enterprise reporting, Excel generally offers greater flexibility.
Collaboration: Where Google Sheets Wins
One of Google Sheets’ biggest strengths is collaboration.
Multiple users can:
- Edit the same spreadsheet simultaneously
- Leave comments
- Suggest changes
- Track revision history
- Share files instantly
This makes it an excellent choice for distributed teams and collaborative projects.
While Excel also supports collaboration through Microsoft 365, Google Sheets offers a smoother experience for real time teamwork.
Working with Large Datasets
As datasets grow, performance becomes increasingly important.
Excel generally handles larger datasets more efficiently and provides additional tools for advanced analysis.
Google Sheets works well for small to medium sized datasets but may become slower with very large files.
For enterprise scale analytics, organizations often combine Excel with SQL databases or Power BI.
Which Tool Is Easier for Beginners?
Both tools are beginner friendly because they share similar spreadsheet concepts.
If you’ve learned one, transitioning to the other is relatively straightforward.
For absolute beginners:
- Google Sheets is easier to access because it’s free and browser based.
Excel offers more advanced features but may take longer to master. - The best approach is to learn spreadsheet fundamentals first and then expand your knowledge to both platforms.

Excel vs Google Sheets, Which Is Better for Data Analytics?
There isn’t a single winner because both tools solve different problems.
Choose Microsoft Excel if you:
- Work with large datasets
- Build advanced dashboards
- Need Power Query for data transformation
- Perform complex financial or business analysis
- Work in enterprise environments
Choose Google Sheets if you:
- Collaborate with teams frequently
- Need cloud based access
- Share reports regularly
- Work with small or medium sized datasets
- Use Google Workspace extensively
Many organizations actually use both tools together depending on the project.
Industry Usage....
Different industries prefer different spreadsheet tools based on their workflows.
Microsoft Excel is commonly used in:
- Banking and Financial Services
- Consulting
- Manufacturing
- Healthcare
- Retail
- Large Enterprises
Google Sheets is widely used in:
- Startups
- Digital Marketing Agencies
- Education
- E-commerce
- Small and Medium Businesses
- Remote Teams
Understanding both tools increases your flexibility and employability.
Can Google Sheets Replace Excel?
For many day to day tasks, Google Sheets can perform the same functions as Excel.
However, Excel still has an advantage when it comes to:
- Advanced data modeling
- Power Query
- Complex formulas
- Large datasets
- Professional financial models
- Enterprise reporting
This is why Excel continues to be the preferred spreadsheet application in many large organizations.
Do Data Analysts Use Both?
Yes. Professional Data Analysts rarely depend on just one tool.
A typical workflow may look like this:
- Extract data using SQL.
- Clean and validate data in Excel.
- Share reports with the team using Google Sheets.
- Build interactive dashboards in Power BI or Tableau.
- Automate analysis using Python when needed.
Learning both spreadsheet tools prepares you for a wider range of business scenarios.
Which Tool Should You Learn First?
If you’re completely new to Data Analytics, the ideal learning path is:
- Learn spreadsheet fundamentals.
- Master Microsoft Excel.
- Learn Google Sheets.
- Move to SQL.
- Learn Power BI or Tableau.
- Learn Python for advanced analytics.
Excel provides a stronger analytical foundation, while Google Sheets helps you collaborate effectively in cloud based environments.
Knowing both tools gives you an advantage during interviews because employers often expect familiarity with each.
Tips to Improve Your Spreadsheet Skills
Regardless of which tool you use, focus on developing these practical skills:
- Formulas and functions
- Lookup functions
- Data cleaning
- Pivot Tables
- Charts and dashboards
- Conditional formatting
- Data validation
- Keyboard shortcuts
- Business reporting
- Data visualization
These are the skills recruiters commonly look for in entry level Data Analysts.
Conclusion is….
Excel vs Google Sheets for Data Analytics is not about choosing one tool over the other, it’s about understanding where each tool performs best. Excel is ideal for advanced analysis, large datasets, and enterprise reporting, while Google Sheets stands out for collaboration, accessibility, and cloud based teamwork.
For aspiring Data Analysts, learning Excel first provides a solid analytical foundation. Adding Google Sheets to your skill set makes you more adaptable and better prepared for modern workplaces where collaboration is just as important as technical expertise.
Modern Data Analysts are expected to work confidently with multiple tools rather than relying on a single platform.
Career247’s Data Analytics Certification Powered by IBM and NASSCOM helps learners develop practical skills in Microsoft Excel, Google Sheets, SQL, Power BI, Tableau, Python, Statistics, GitHub, Business Intelligence, and Generative AI.

Frequently Asked Questions
Answer:
Both are excellent tools. Excel is generally better for advanced analysis and larger datasets, while Google Sheets is better for collaboration and cloud based workflows.
Answer:
Yes. Excel offers more advanced analytical features and provides a strong foundation. Once you understand Excel, learning Google Sheets becomes much easier.
Answer:
Yes. Many startups, marketing agencies, consulting firms, and small businesses use Google Sheets for reporting, collaboration, and operational analysis.
Answer:
Absolutely. Excel remains one of the most widely used tools in Data Analytics because of its advanced formulas, Pivot Tables, Power Query, dashboard capabilities, and integration with Microsoft’s analytics ecosystem.
Answer:
Learning both spreadsheet tools is an excellent start, but you should also develop skills in SQL, Power BI, Tableau, Python, and Statistics to become job ready.

