
Data Observability Explained for Modern Analytics Teams
Data Observability Explained for Modern Analytics Teams
Modern analytics teams run on pipelines that move data across dozens of systems every single day, and any one of those systems can silently break without anyone noticing until a dashboard looks wrong or a report contradicts itself. This is exactly the problem that data observability was built to solve. Instead of waiting for a broken metric to surface in a leadership meeting, observability gives teams visibility into the health of their data before it causes damage. This article explains what data observability actually means, why it has become essential for analytics teams, and how to start building it into your own data stack.

What Data Observability Actually Means
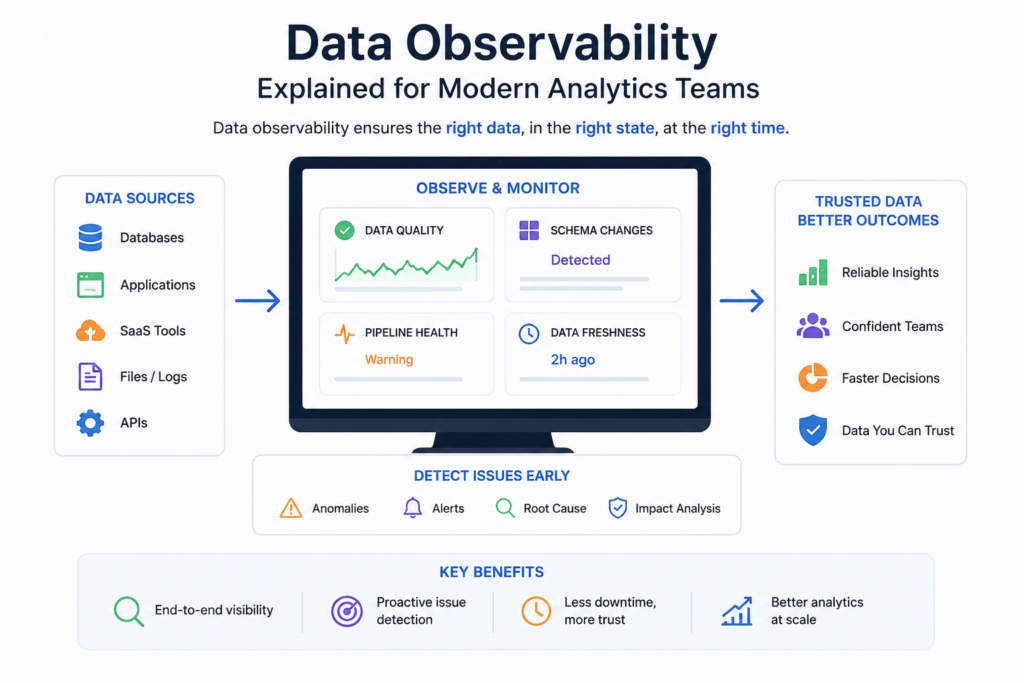
Data observability is the ability to understand the internal state and health of your data systems by monitoring signals such as freshness, volume, schema, distribution, and lineage. It borrows heavily from software engineering, where observability has long been used to monitor application uptime and performance. Applied to data, the goal is the same: catch problems early, understand their root cause quickly, and prevent bad data from silently spreading downstream into dashboards, models, and business decisions.
Unlike a one-time data quality check, data observability is continuous. It runs constantly in the background, watching pipelines the same way infrastructure monitoring watches servers, so that issues are flagged the moment they appear rather than discovered weeks later during a routine audit.
The Five Pillars of Data Observability
Most data observability frameworks are built around five core pillars, each capturing a different dimension of data health.
Freshness
Freshness tracks whether data is arriving on the expected schedule. If a table that should update every hour has not refreshed in six hours, freshness monitoring flags it immediately, long before someone notices a stale dashboard.
Volume
Volume monitoring watches the number of rows or records flowing through a pipeline. A sudden drop or spike in volume often signals a broken data source, a failed job, or an unexpected duplication issue.
Schema
Schema monitoring detects changes in the structure of data, such as a renamed column, a changed data type, or a removed field, any of which can silently break downstream reports and models if left unnoticed.
Distribution
Distribution tracks whether the values within a field fall within an expected range or pattern. A sudden shift, such as a percentage field showing values above 100, usually indicates an upstream error.
Lineage
Lineage maps how data flows from its original source through every transformation to its final destination. When something breaks, lineage makes it possible to trace the issue back to its root cause instead of guessing where the problem started.


Why Data Observability Has Become Essential
As companies rely on data for more decisions, the cost of bad data has grown just as fast as the volume of data itself. A single broken pipeline can silently corrupt dozens of downstream reports, dashboards, and even machine learning models before anyone notices. Data observability addresses several pain points that traditional, manual quality checks simply cannot keep up with.
- Pipelines have become too complex and numerous for manual review to catch every issue
- Data teams are often blamed for bad numbers they did not know were wrong
- Business stakeholders lose trust in analytics after repeated silent errors
- Root cause investigation without lineage visibility can take days instead of minutes
- Machine learning models trained on undetected bad data can quietly degrade in accuracy
Data Observability vs. Traditional Data Quality Checks
It is easy to confuse data observability with standard data quality checks, but the two operate differently. Traditional data quality checks are typically rule-based and run at specific points, such as validating that a field is never blank. Data observability is broader and continuous, often using historical patterns and even machine learning to detect anomalies that a fixed rule would never catch, such as a subtle shift in the relationship between two related metrics.
In practice, the strongest data teams use both together. Fixed rules catch obvious, well-understood issues quickly and cheaply, while broader observability monitoring catches the unexpected problems that no one thought to write a rule for in advance.
How to Start Building Data Observability Into Your Stack
Building observability does not require replacing your entire data infrastructure overnight. Most teams start small and expand coverage gradually.
- Identify your most business-critical tables and pipelines first, rather than trying to monitor everything at once.
- Set up basic freshness and volume alerts on those critical tables as a starting point.
- Document expected schema for key tables so unexpected changes can be flagged automatically.
- Introduce lineage tracking so root cause investigations become faster when something does break.
- Gradually expand monitoring to more tables and pipelines as your team builds confidence in the system.
- Review alerts regularly to tune thresholds and reduce noise from false alarms.
Common Mistakes Teams Make When Adopting Observability
Even well-intentioned teams can stumble when first introducing data observability practices. Common pitfalls include:
- Trying to monitor every single table at once, leading to alert fatigue and ignored notifications
- Setting alert thresholds too tight, causing constant false alarms that erode trust in the system
- Treating observability as a one-time setup project instead of an ongoing practice
- Failing to assign clear ownership for responding to alerts once they are triggered
- Not connecting observability alerts to actual business impact, making it hard to prioritize which issues matter most
The Business Case for Investing in Data Observability
Beyond the technical benefits, data observability has a clear business case. Every hour spent manually hunting for the source of a data error is an hour not spent on analysis that actually drives decisions. Every bad number that reaches leadership before being caught chips away at trust in the analytics function overall, making stakeholders second-guess future reports even after the issue is fixed.
Companies that invest early in data observability typically see faster incident resolution times, fewer repeat data quality problems, and stronger trust between data teams and business stakeholders. As more of the business relies on real-time and automated decision-making, the cost of an undetected data issue only grows larger, making observability an increasingly critical part of any serious analytics operation.
Tools and Approaches Commonly Used
A wide range of dedicated data observability platforms have emerged in recent years, alongside features built into modern data warehouses and orchestration tools. Regardless of which specific platform a team chooses, most solutions share a similar approach: connecting to existing data pipelines, automatically learning normal patterns of freshness and volume, and alerting teams when something deviates significantly from that baseline. Some teams start with lightweight, custom-built monitoring scripts before graduating to a dedicated platform as their data infrastructure grows in complexity.
How Data Observability Fits Into a Broader Data Strategy
Data observability does not exist in isolation. It works best as one layer within a broader data strategy that also includes clear data ownership, well-documented definitions for key metrics, and a culture where data issues are reported and fixed quickly rather than quietly ignored. A company can have excellent observability tooling in place and still struggle if nobody is clearly responsible for responding when an alert fires, or if there is no established process for communicating a data incident to the business teams affected by it.
The strongest data organizations treat observability as connective tissue between engineering, analytics, and business teams. Engineers benefit from early detection of pipeline failures, analysts benefit from confidence that the numbers they report are accurate, and business stakeholders benefit from fewer surprises and corrections after decisions have already been made based on a report.
Measuring the Return on Investment of Observability
Because data observability is often a proactive investment, it can be harder to justify than tools with more obvious, immediate output. Teams looking to build a business case for observability tooling or dedicated headcount can track a few concrete indicators over time.
- Average time to detect a data incident before and after implementing observability monitoring
- Average time to resolve an incident once detected, especially with lineage tracking in place
- Number of data incidents that reach a business stakeholder or dashboard before being caught internally
- Hours spent by analysts manually investigating data issues that could be caught automatically
- Stakeholder confidence in reported metrics, measured informally through surveys or feedback
A Simple Example of Data Observability in Action
Consider an e-commerce company whose daily sales table normally receives around fifty thousand new rows every night through an automated pipeline. One evening, due to an upstream integration issue with a payment processor, the pipeline only receives twelve thousand rows. Without observability monitoring, this would likely go unnoticed until someone manually reviewed the next morning’s revenue report and wondered why numbers looked unusually low, by which point the incomplete data may have already been used to update multiple downstream dashboards and even automated inventory decisions.
With volume monitoring in place as part of a data observability setup, an automated alert would trigger the moment the row count falls dramatically below the expected range, notifying the responsible data engineer within minutes rather than hours. Lineage tracking would then help the team quickly trace the issue back to the specific payment processor integration, rather than manually checking every possible upstream system one by one. This kind of fast detection and resolution is exactly what separates teams with strong observability practices from those still relying on manual, after-the-fact troubleshooting.
Conclusion
As data pipelines grow more complex and business decisions increasingly depend on real-time information, data observability has moved from a nice-to-have into a genuine necessity for modern analytics teams. By monitoring freshness, volume, schema, distribution, and lineage continuously, teams can catch problems before they damage trust or lead to costly decisions based on broken numbers. Investing in observability early pays off through faster incident response, stronger stakeholder confidence, and a data culture where people can trust the numbers in front of them without constantly second-guessing their accuracy. As data ecosystems continue to grow more interconnected, the organizations that treat observability as a core discipline, rather than an afterthought, will be the ones best equipped to scale their analytics reliably.
Frequently Asked Questions
Answer:
Data observability is the practice of continuously monitoring the health, quality, and reliability of data across pipelines. It helps analytics teams detect issues such as missing, inaccurate, or delayed data before they impact dashboards, reports, or business decisions. By improving visibility into data systems, teams can ensure trusted analytics and reduce downtime.
Answer:
While data monitoring typically checks predefined metrics or system performance, data observability goes much deeper. It analyzes data freshness, volume, schema changes, lineage, and quality to identify the root cause of issues. This proactive approach enables analytics teams to resolve problems faster and prevent recurring data failures.
Answer:
The core pillars of data observability include data freshness, data volume, schema validation, data lineage, and data quality monitoring. Together, these components provide a complete view of the data lifecycle and help teams identify anomalies before they affect downstream analytics or business operations.
Answer:
Data observability improves data reliability, reduces troubleshooting time, and increases confidence in business reports. It helps analytics teams quickly identify pipeline failures, detect unexpected data changes, and ensure stakeholders always work with accurate and up-to-date information. This ultimately leads to better decision-making and operational efficiency.
Answer:
Popular data observability tools include Monte Carlo, Bigeye, Databand, Soda, Great Expectations, and Metaplane. These platforms monitor data pipelines, validate data quality, detect anomalies, and provide alerts when issues occur. The right tool depends on your data stack, scalability requirements, and monitoring needs.

