
How to Perform Root Cause Analysis Using Data Analytics
How to Perform Root Cause Analysis Using Data Analytics
Something breaks. A conversion rate falls, a machine on the floor starts failing more often, a support queue suddenly doubles. The instinct in most offices is to patch it fast and move on. The problem is that patching the symptom without finding the actual cause means the same issue tends to crawl back a few weeks later, usually at a worse time. Root cause analysis is the process of refusing to settle for the quick patch and instead tracing a problem back to where it actually started.
Doing this well used to lean heavily on instinct and experience. These days, with data sitting in nearly every system a business runs on, root cause analysis has become a much more structured, evidence backed process. This guide walks through how that process actually works when data analytics is doing the heavy lifting, step by step, with the pitfalls included along the way, since most of the lessons in this kind of work come from getting it wrong at least once.

What Root Cause Analysis Actually Means
Root cause analysis is a method for identifying the true, underlying source of a problem rather than just its visible symptoms. A late shipment isn’t the root cause of a customer complaint, it’s a symptom of something further upstream, maybe a supplier delay, a warehouse staffing gap, or a scheduling error nobody caught.
When data analytics gets involved, the process stops being guesswork and starts being something closer to investigative work backed by evidence. Instead of relying purely on who remembers what happened, an analyst pulls the actual records, logs, and metrics tied to the event and lets that evidence narrow down the possibilities. The instinct of an experienced person still matters here, it’s just no longer the only thing driving the conclusion.
Why Bother Going This Deep
Fixing a symptom feels productive in the moment, but it rarely holds. If a website’s checkout page is timing out and the fix is just restarting the server, the same crash tends to come back the next time traffic spikes, because the actual bottleneck never got addressed. Root cause analysis exists to catch that bottleneck the first time, not the fifth. There’s also a cost angle worth mentioning, repeated fixes for the same recurring issue eat up far more time over a year than one proper investigation would.
Step 1: Define the Problem Clearly
This sounds obvious, but it’s the step most often rushed. A vague problem statement like sales are down leads to a vague, unproductive investigation. A sharper version, like online sales for one specific product category dropped eighteen percent in the last two weeks compared to the prior month, gives an analyst something concrete to actually chase. Vague framing wastes hours later, since half the early work ends up being spent figuring out what question is even being asked.
- Specify what metric changed, by how much, and over what time frame
- Note where the problem is showing up, a region, a product line, a customer segment
- Avoid assuming a cause at this stage, the goal here is just to describe what’s observed
Step 2: Gather the Relevant Data
Once the problem is framed clearly, the next move is pulling together every dataset that could plausibly be connected to it. This is usually messier than people expect, since relevant data often lives scattered across different systems that don’t talk to each other particularly well.
- Transaction or sales records tied to the affected metric
- Operational logs, like website performance data, inventory records, or production logs
- Customer feedback or support tickets, if the issue is customer facing
- Historical data covering a comparable prior period for context
- Any external factors worth checking, like marketing changes, competitor activity, or seasonal patterns
It’s worth resisting the urge to skip straight to the dataset that seems most obviously relevant. Sometimes the real explanation sits in a system nobody thought to check first.
Step 3: Clean and Organize the Data
Raw data is rarely investigation ready straight out of the source system. Duplicate entries, missing fields, inconsistent date formats, all of that needs sorting out before any analysis can be trusted. Skipping this step is one of the more common reasons root cause investigations land on the wrong answer.
- Remove duplicate or test records that could skew totals
- Standardize formats across different data sources so they can actually be compared
- Flag and review any missing or incomplete entries before drawing conclusions from them
- Align time periods correctly, so comparisons are apples to apples
Step 4: Use Descriptive Analytics to Confirm the Pattern
Before diving into causes, it helps to confirm the problem is real and consistent, not a one off blip or a reporting error. Descriptive analytics, simple summaries, averages, and trend lines, is the right tool for this stage. If the drop in sales only shows up in one report but not in the underlying transaction data, that’s worth catching early before chasing a cause that doesn’t actually exist.
Step 5: Apply Diagnostic Techniques to Narrow the Cause
This is where the actual investigation happens, and it usually involves layering a few different methods rather than relying on just one.
- Drill-down analysis: break the overall number into smaller segments, by region, product, time of day, or channel, until the issue concentrates somewhere specific.
- Correlation checks: look for other metrics that moved at the same time as the problem, which can point toward a connected factor worth investigating further.
- Time-based comparison: line up the timing of the change against known events, like a price update, a system deployment, or a policy shift.
- The Five Whys: repeatedly ask why a finding occurred, peeling back one layer at a time until a clear, addressable cause is left standing.
- Regression analysis: where multiple factors might be involved at once, this helps quantify how much each one actually contributed to the outcome.
Step 6: Validate the Finding Before Acting on It
It’s tempting to stop the moment a plausible cause turns up, but a plausible cause and a confirmed one aren’t the same thing. Before rolling out a fix, it’s worth testing the theory against a different slice of the data, or checking whether the same pattern shows up consistently across other comparable periods.
- Cross check the suspected cause against a separate dataset or time period
- Talk to people closer to the process, since data sometimes misses operational context
- Watch for confounding variables that might explain the pattern just as well
- Be willing to discard a theory that doesn’t hold up under a second look
Step 7: Document and Communicate the Findings
A root cause that nobody acts on is just trivia. Once the cause is confirmed, it needs to be written up clearly enough that people outside the analytics team can actually understand it and decide what to do next. This usually means translating statistical findings into plain language, supported by a chart or two rather than a wall of numbers.
- State the original problem and the confirmed cause in plain terms
- Include the evidence that supports the conclusion, not just the conclusion itself
- Suggest a next step or fix, even if the final decision belongs to someone else
- Keep a record of the investigation for future reference, in case something similar happens again


Common Mistakes to Avoid Along the Way
A handful of mistakes show up again and again in root cause work, often because the pressure to find an answer quickly pushes people past steps that actually matter.
- Jumping to the first explanation: the first theory that fits the data isn’t always the right one, and confirming it properly takes a little patience.
- Treating correlation as proof: two things moving together doesn’t mean one caused the other, and skipping this distinction leads to bad fixes.
- Working from incomplete data: a partial dataset can support a confident sounding conclusion that’s still wrong.
- Ignoring human context: sometimes the data doesn’t capture the full story, and a conversation with the team closest to the process fills in the gap.
- Stopping at one cause: some problems have more than one contributing factor, and stopping the search too early misses the rest.
Tools That Make This Process Easier
None of this requires a massive tech stack, though the right tools do speed things up considerably.
- Spreadsheet software, for smaller scale investigations and quick pivot tables
- SQL, for querying and segmenting larger datasets directly from source systems
- BI dashboards, for drill-down analysis and visual pattern spotting
- Statistical software, for correlation and regression work when multiple variables are involved
- Collaboration tools, for documenting findings in a way the wider team can actually access and review
A Quick Walkthrough Example
It helps to see this end to end with a concrete scenario rather than just abstract steps. Say a subscription business notices its monthly cancellation rate jumped from four percent to nine percent over the last billing cycle. The problem statement gets defined precisely first, cancellations among monthly plan subscribers rose from four to nine percent between last month and this one, concentrated in accounts that joined within the past ninety days.
From there, the team pulls billing records, support tickets, product usage logs, and a record of any recent pricing or feature changes. After cleaning the data and confirming the spike is real and not a reporting glitch, drill-down analysis shows the increase is heaviest among users on a specific plan tier. A time based comparison lines the spike up almost exactly with a price increase rolled out three weeks earlier. A few rounds of the Five Whys confirm that the increase wasn’t communicated clearly to existing subscribers, who felt blindsided rather than gradually adjusted to it.
That’s a root cause, not a symptom. The fix isn’t simply to roll back the price, it’s to fix how pricing changes get communicated going forward, and possibly to offer existing affected subscribers a transition period. None of that would have been obvious from the cancellation number alone.
Putting It All Together
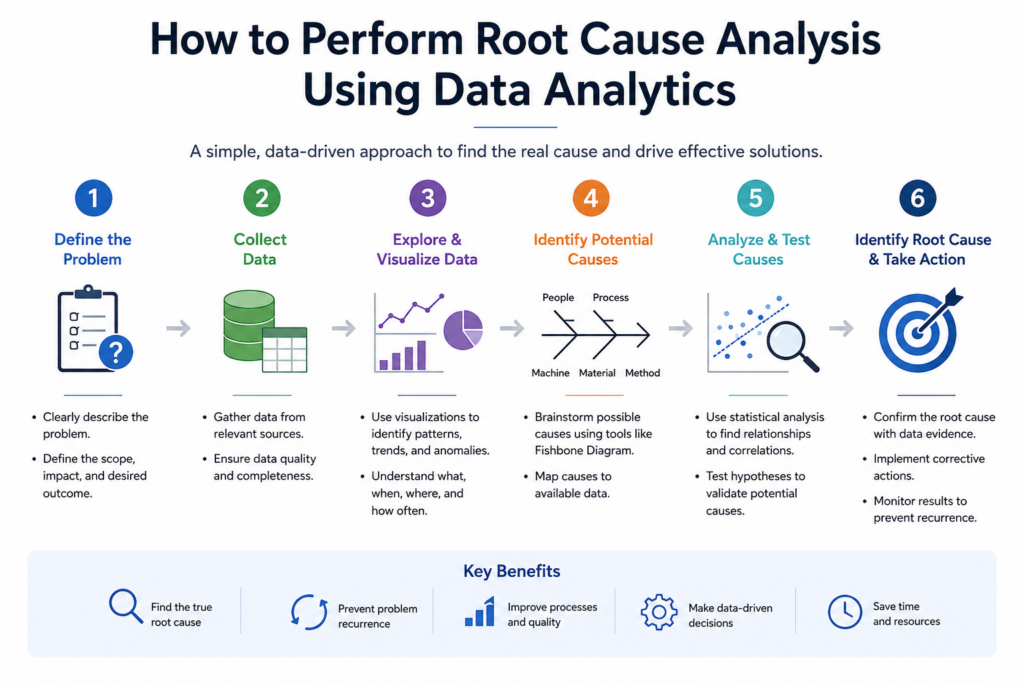
Root cause analysis using data analytics isn’t really about running one clever formula. It’s a sequence, define the problem precisely, gather and clean the right data, confirm the pattern is real, narrow the cause through diagnostic techniques, validate the finding, then communicate it clearly enough that someone can actually act on it. Skipping steps usually doesn’t save time, it just moves the same problem further down the road to resurface later.
Teams that get good at this tend to treat every recurring issue as a prompt to ask one more question rather than reach for the fastest available fix. That habit, more than any specific tool or technique, is usually what separates an investigation that actually solves something from one that just produces a report.
Frequently Asked Questions
Answer:
The main goal is to identify the true underlying source of a problem rather than just addressing its visible symptoms. This helps prevent the same issue from recurring, since fixing a symptom without addressing the actual cause usually means the problem comes back later.
Answer:
Troubleshooting often focuses on quickly resolving an immediate issue, while root cause analysis digs deeper to understand why the issue happened in the first place. Troubleshooting might restart a system, while root cause analysis figures out why it crashed to begin with.
Answer:
The Five Whys technique is one of the most widely used, since it’s simple and doesn’t require advanced statistical tools. It involves repeatedly asking why a problem occurred until the explanations stop producing new, useful answers.
Answer:
Yes, smaller scale investigations can often be handled with basic spreadsheet tools and simple data pulls from existing systems. More complex cases involving multiple variables may benefit from statistical software, but the core process doesn’t require a large dedicated team.
Answer:
A confirmed root cause should hold up when tested against a different time period or data segment, not just the original dataset where it was first spotted. It should also make logical sense when explained to someone familiar with the process being investigated.

