
How to Publish and Share Tableau Dashboards
Publish and Share Tableau Dashboards Across Teams and Organizations
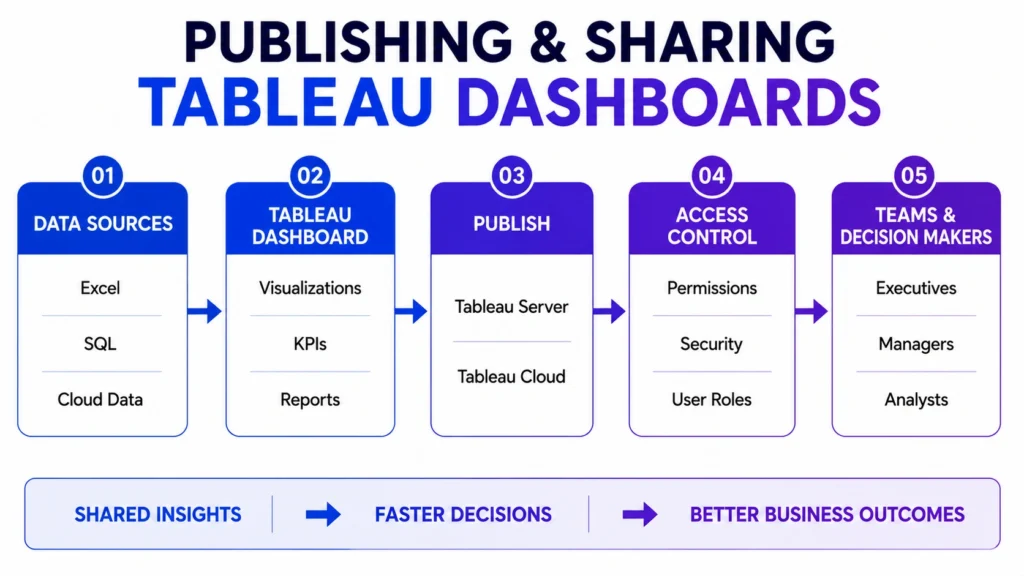
Creating a dashboard is only part of the analytics process. The real value comes when insights reach the people who need them. This is where the ability to publish Tableau dashboards becomes essential.
Organizations use Tableau not just to analyze data, but also to distribute insights across departments, teams, and leadership groups. A well designed dashboard can help managers track KPIs, executives monitor business performance, and operational teams make faster decisions.
By publishing and sharing dashboards, businesses ensure that data is accessible, consistent, and actionable across the organization.

Why Dashboard Sharing Matters
Imagine a company where each department maintains separate reports and spreadsheets.
This often leads to:
- Conflicting numbers
- Delayed reporting
- Manual updates
- Lack of visibility
Publishing Tableau dashboards helps create a single source of truth where everyone works from the same data.
Benefits of Dashboard Sharing:
- Improved collaboration
- Faster decision making
- Consistent reporting
- Better KPI monitoring
- Reduced manual reporting effort
This is one of the reasons why Tableau has become a widely adopted Business Intelligence platform.
What Does Publishing a Tableau Dashboard Mean?
Publishing a Tableau dashboard means moving it from a local development environment to a platform where others can access and interact with it.
Instead of sharing static screenshots or spreadsheets, users can access live dashboards through a browser or mobile device.
The publishing process allows organizations to:
- Centralize reporting
- Control access
- Maintain data security
- Enable self service analytics
Tableau Server vs Tableau Cloud
Organizations typically share dashboards through one of two platforms.
1. Tableau Server
Tableau Server is hosted and managed by the organization.
Advantages:
- Greater control
- Internal data governance
- Custom security policies
Commonly used by large enterprises.
2. Tableau Cloud
Tableau Cloud is Tableau’s hosted platform.
Advantages:
- Faster deployment
- Lower infrastructure requirements
- Easy access from anywhere
Popular among organizations adopting cloud based analytics.
Steps to Publish a Tableau Dashboard
The publishing process is generally straightforward.
Step 1: Create and Test the Dashboard
Before publishing:
- Verify calculations
- Validate filters
- Check visualizations
- Test interactions
A dashboard should be accurate before being shared.
Step 2: Connect to Tableau Server or Tableau Cloud
Users sign in to the publishing platform and establish a connection.
This creates the environment where dashboards will be stored and accessed.
Step 3: Publish the Workbook
The workbook is uploaded to the selected Tableau environment.
During publishing, users can specify:
- Project location
- Dashboard name
- Data source settings
- Access permissions
Step 4: Configure Permissions
Not everyone needs access to every dashboard.
Organizations typically control:
- View access
- Editing rights
- Download permissions
- Administrative privileges
This helps maintain security and governance.
Step 5: Share with Stakeholders
Once published, dashboards can be shared through:
- Direct links
- Team workspaces
- Business portals
- Embedded applications
Users can access dashboards through web browsers and supported mobile devices.

Ways to Share Tableau Dashboards
1. Department Level Sharing
Teams can access dashboards relevant to their work.
Examples:
- Sales Dashboards
- Marketing Dashboards
- Finance Dashboards
- Operations Dashboards
2. Executive Reporting
Leadership teams often rely on executive dashboards that provide:
- Revenue metrics
- Growth indicators
- Business KPIs
- Strategic performance summaries
3. Organization Wide Analytics
Some dashboards are designed for broader visibility across departments.
Examples include:
- Company Performance Dashboards
- KPI Dashboards
- Operational Monitoring Dashboards
Dashboard Permissions and Security
Security is a critical aspect of dashboard sharing.
Organizations often implement:
1. Role Based Access
Different users receive different levels of access.
Examples:
- Executives
- Managers
- Analysts
- Department Users
2. Data Level Security
Certain users may only view data relevant to their department or region.
This protects sensitive business information.
3. Audit and Monitoring
Organizations can track:
- Dashboard usage
- User activity
- Access patterns
These insights help improve governance and adoption.
Best Practices for Sharing Tableau Dashboards
- Keep Dashboards Simple:
- Users should understand key insights quickly.
- Avoid excessive charts and unnecessary complexity.
- Focus on Business KPIs:
- Dashboards should highlight metrics that support decision making.
- Use Consistent Design Standards:
- Consistent layouts improve usability and adoption.
- Refresh Data Regularly:
Outdated data reduces trust in dashboards.
Automated refresh schedules help maintain accuracy.
- Train Dashboard Users:
Even great dashboards require user adoption.
Provide guidance on:
- Filters
- Navigation
- KPI interpretation
Common Challenges in Dashboard Deployment
- Access Issues: Users may not have appropriate permissions.
- Data Refresh Failures: Dashboard data can become outdated if refresh schedules fail.
- Performance Problems: Large datasets can impact dashboard speed.
- Low User Adoption: Complex dashboards often discourage usage.
Proper planning and governance help address these challenges.
Real world example:
Consider a retail company.
The organization publishes a centralized Tableau dashboard containing:
- Sales Performance
- Store Revenue
- Inventory Levels
- Customer Trends
So,
- Executives view company wide metrics.
- Regional managers access regional data.
- Store managers see local performance information.
Everyone works from the same trusted data source while maintaining appropriate access controls.
Why Publishing Skills Matter for Data Analysts
Many beginners focus only on creating visualizations.
However, businesses need analysts who can also:
- Deploy dashboards
- Manage permissions
- Share insights effectively
- Support collaboration
- Enable self service analytics
Publishing and sharing dashboards is often the final step that transforms analysis into business value.
So the conclusion is that….
Building a dashboard is only the beginning. The true impact of analytics comes when insights are shared with the right people at the right time. Tableau’s publishing and sharing capabilities help organizations transform dashboards into collaborative decision making tools that support business growth and operational efficiency.
Whether through Tableau Server or Tableau Cloud, effective dashboard deployment ensures that data remains accessible, secure, and actionable across teams and organizations.
Learn Tableau and Dashboard Deployment Skills with Career247
Modern analytics roles require more than just creating charts. Professionals are expected to build dashboards, manage data sources, communicate insights, and support business decision making.
Career247’s Data Analytics with GenAI Course covers Tableau, Power BI, SQL, Statistics, Dashboard Design, Data Storytelling, Business Intelligence, and real world analytics projects. Learners gain practical experience in the complete analytics workflow, from data preparation to dashboard publishing and stakeholder reporting.

Frequently Asked Questions
Answer:
Publishing a Tableau dashboard means making it available on Tableau Server or Tableau Cloud so other users can access and interact with it.
Answer:
Dashboards can be shared through Tableau Server, Tableau Cloud, direct links, embedded applications, or organizational portals.
Answer:
Tableau Server is managed internally by an organization, while Tableau Cloud is a hosted service managed by Tableau.
Answer:
Permissions help control who can view, edit, or manage dashboards, ensuring security and proper governance.
Answer:
Sharing enables teams, managers, and executives to access consistent data and make informed business decisions.

